. 2007 May 4;282(18):13199-210.
doi: 10.1074/jbc.M610225200. Epub 2007 Mar 8.

Protein kinase C delta is required for survival of cells expressing activated p21RAS

Affiliations

Protein kinase C delta is required for survival of cells expressing activated p21RAS

Shuhua Xia et al. J Biol Chem. .

Abstract

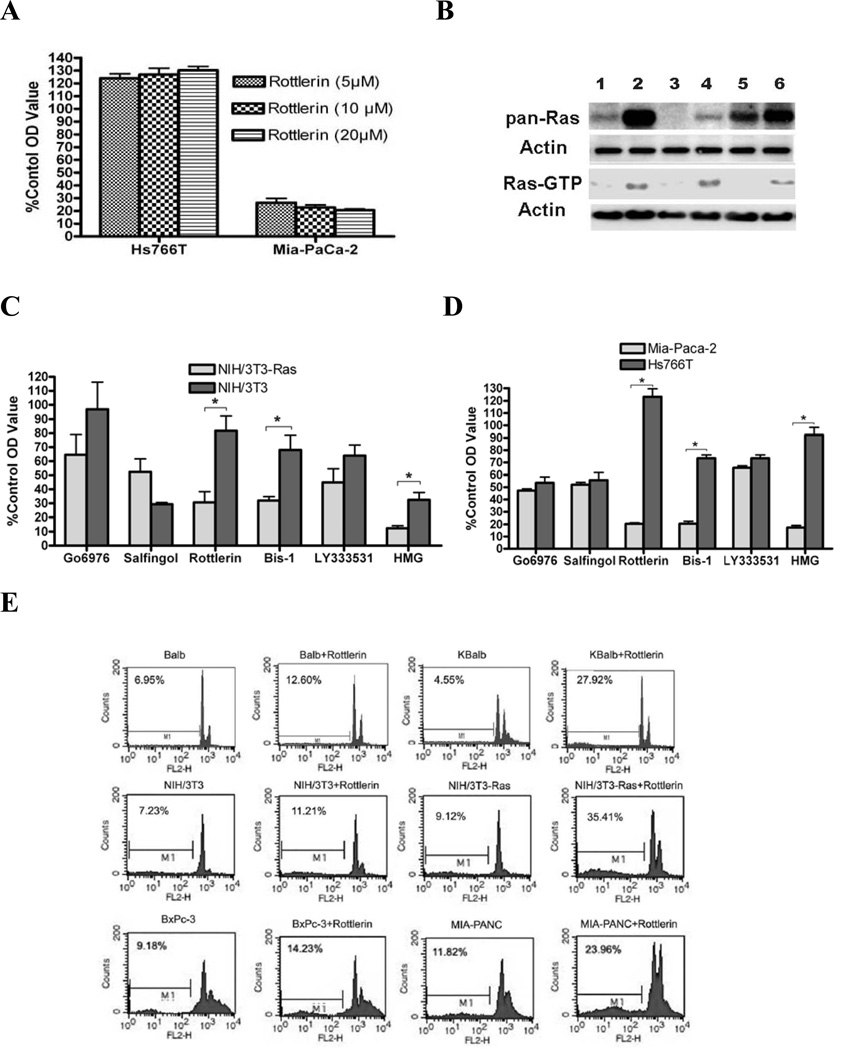
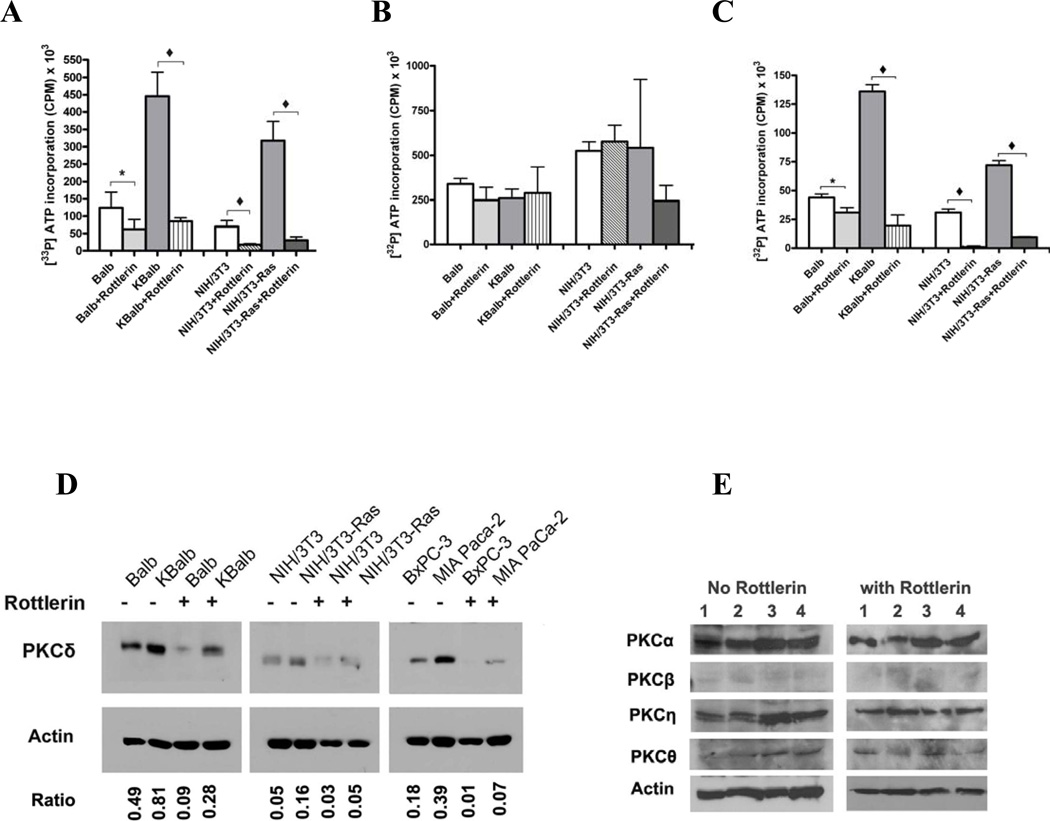
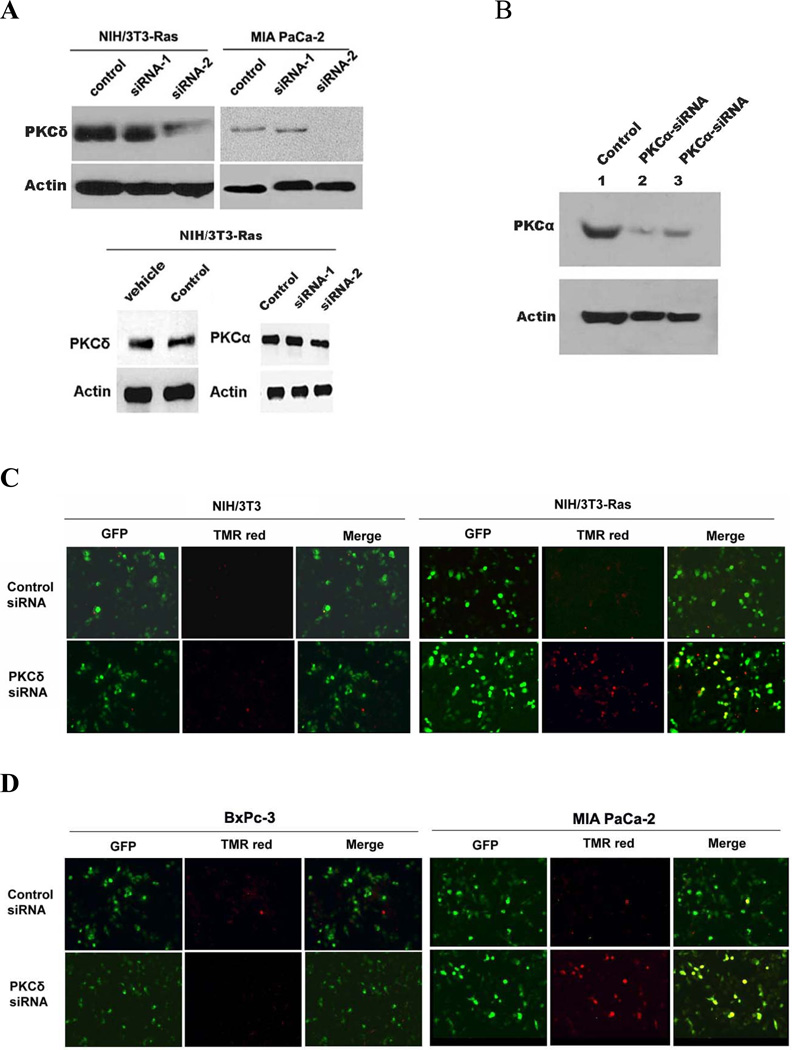
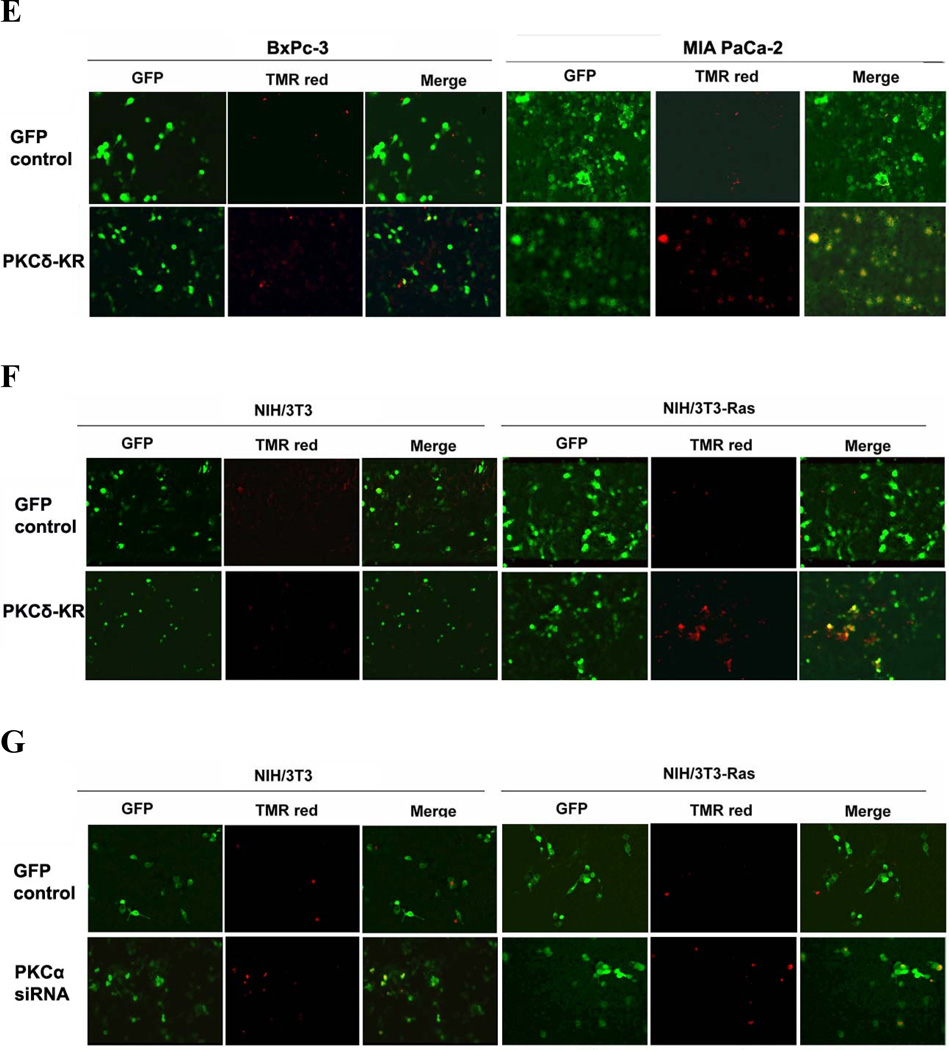
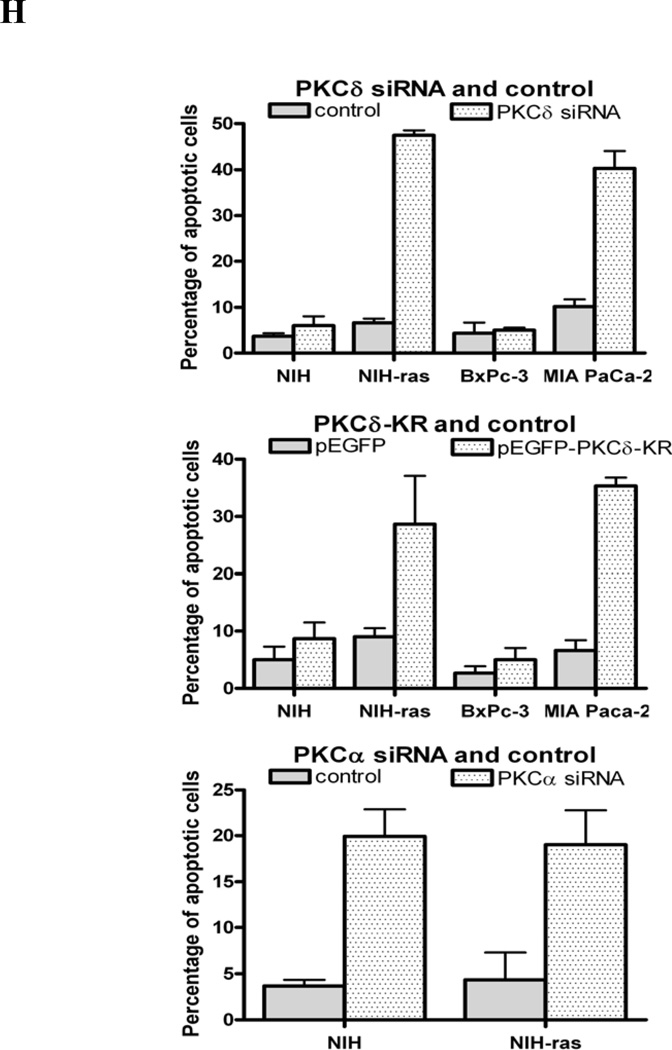
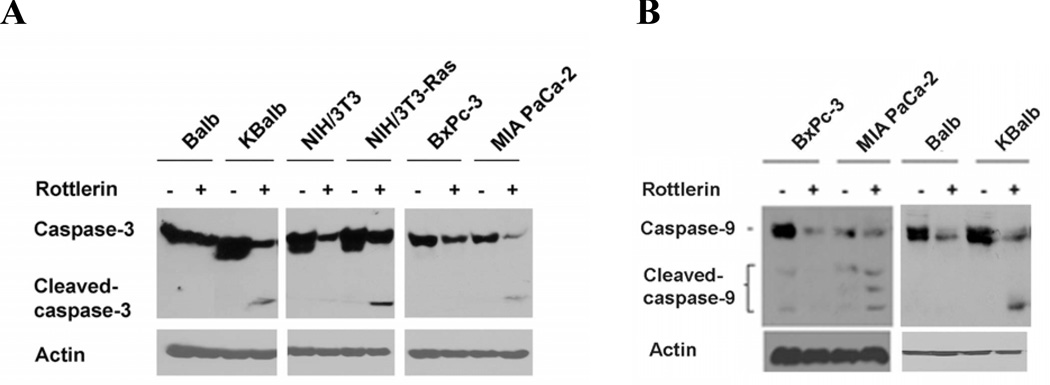
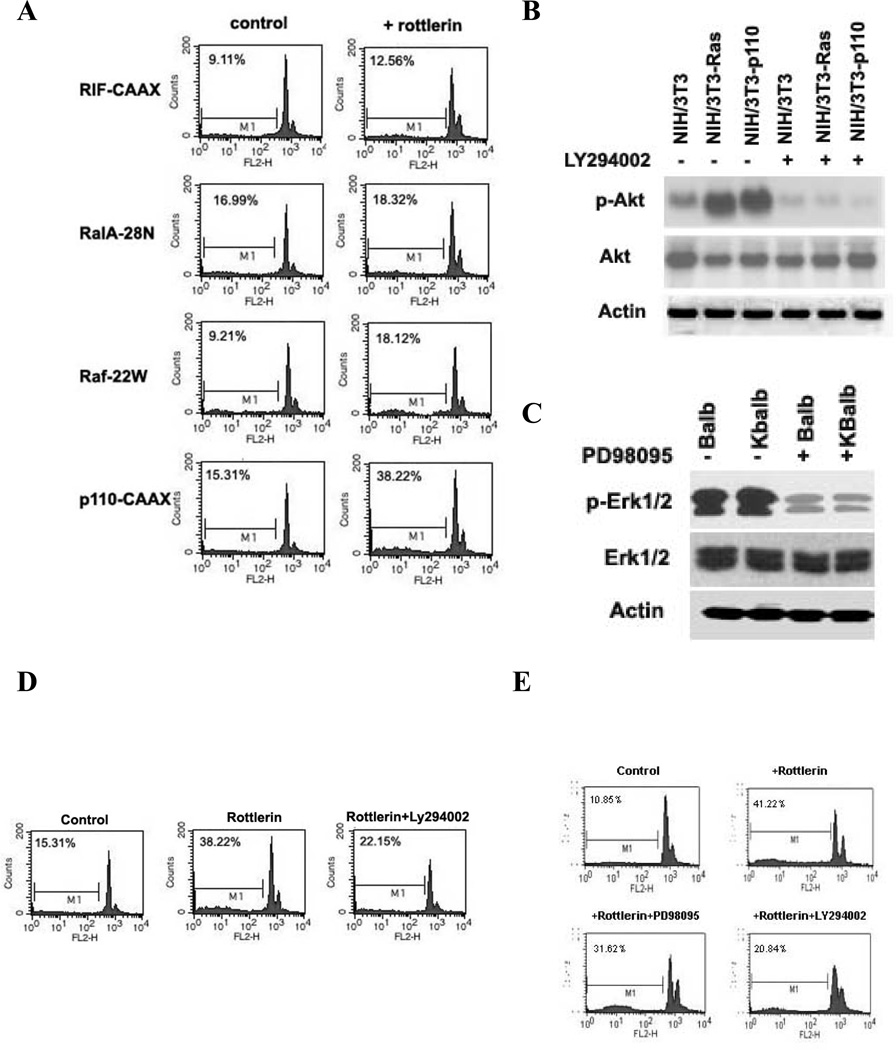
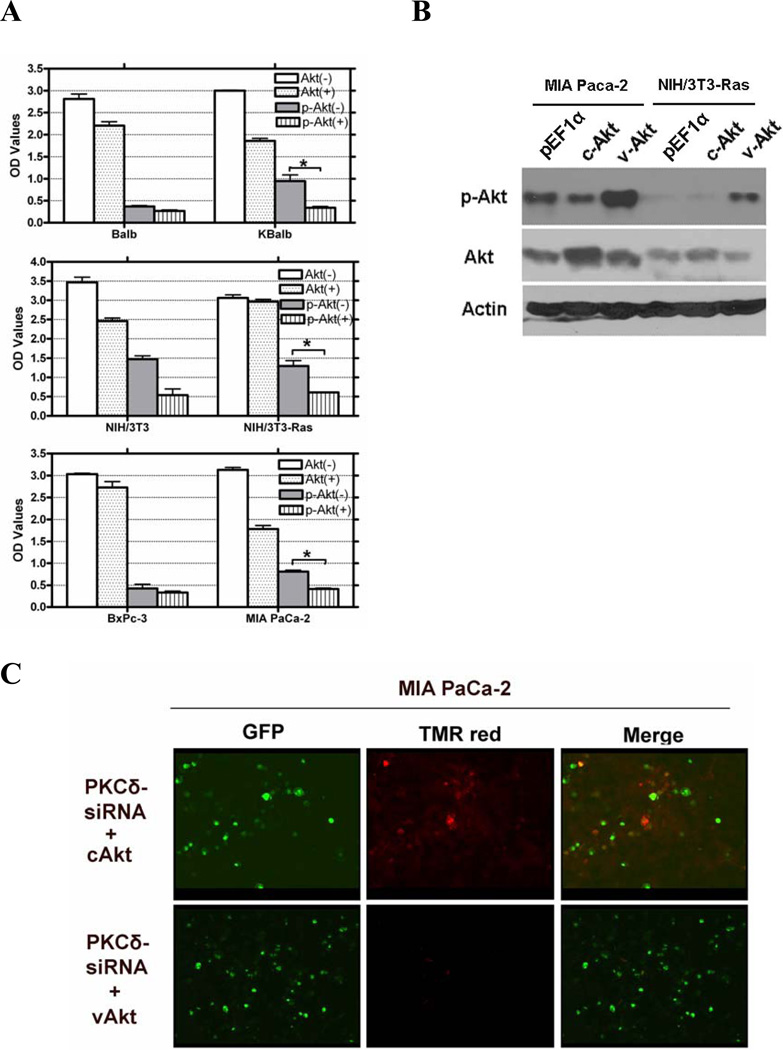
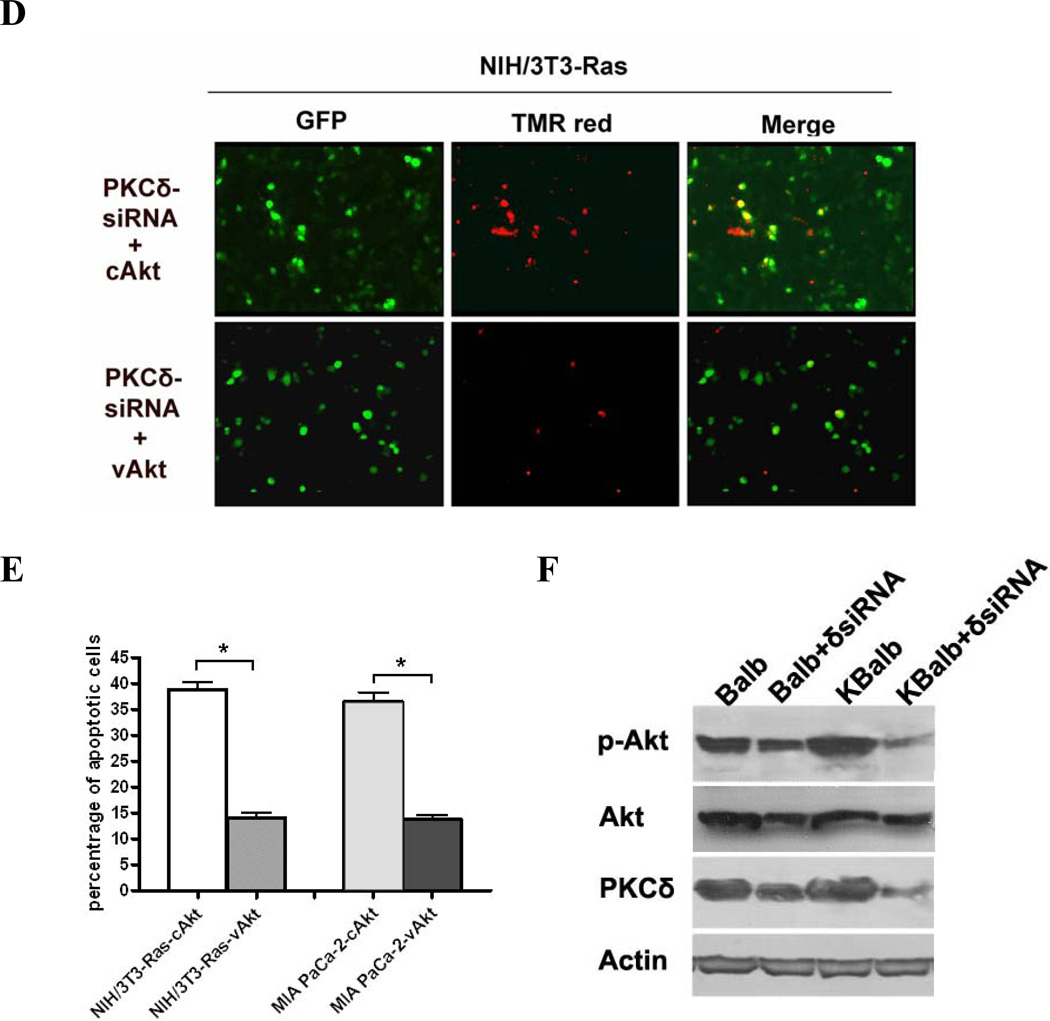
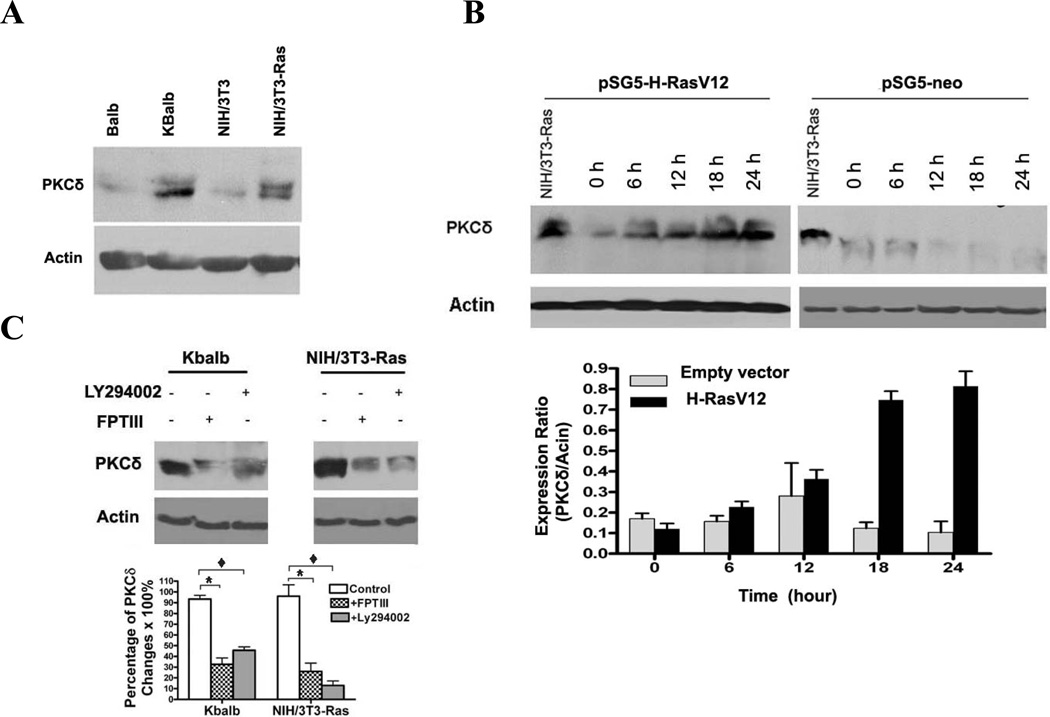
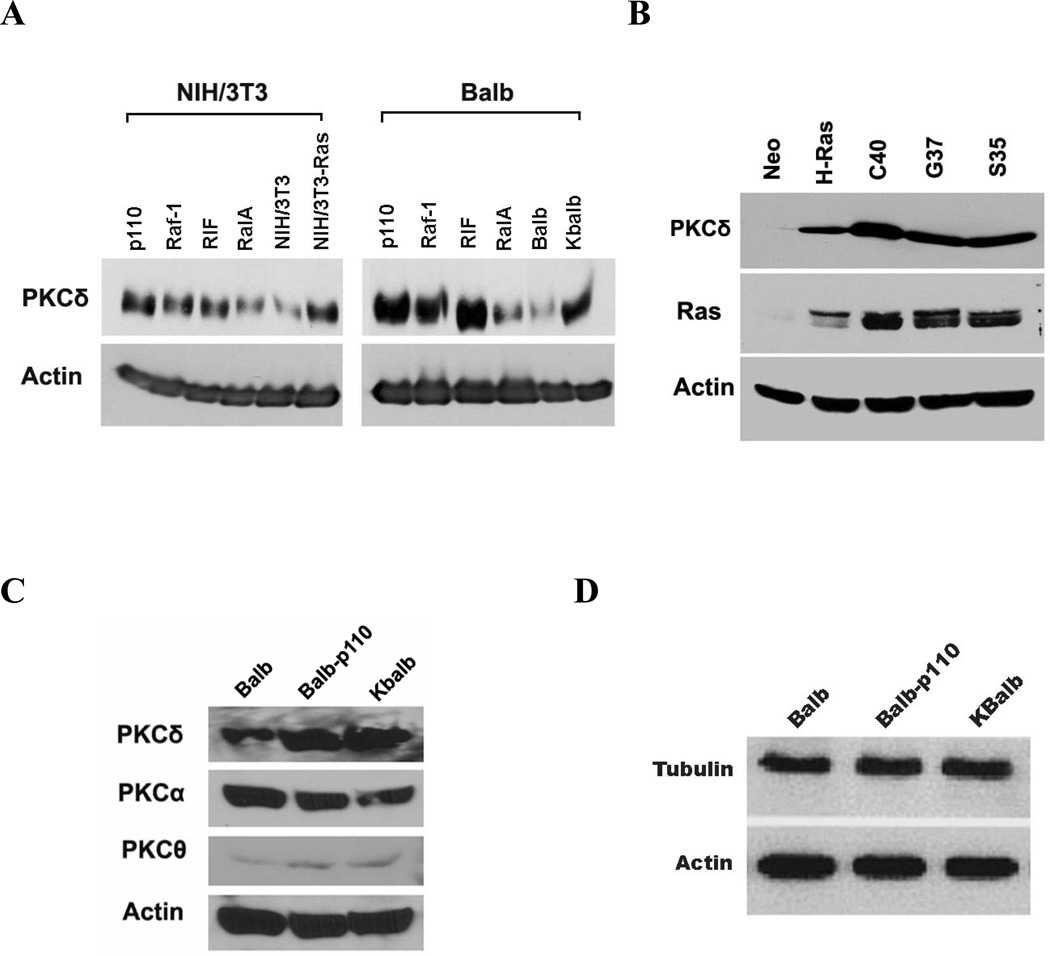
Inhibition of protein kinase C (PKC) activity in transformed cells and tumor cells containing activated p21(RAS) results in apoptosis. To investigate the pro-apoptotic pathway induced by the p21(RAS) oncoprotein, we first identified the specific PKC isozyme necessary to prevent apoptosis in the presence of activated p21(RAS). Dominant-negative mutants of PKC, short interfering RNA vectors, and PKC isozyme-specific chemical inhibitors directed against the PKCdelta isozyme demonstrated that PKCdelta plays a critical role in p21(RAS)-mediated apoptosis. An activating p21(RAS) mutation, or activation of the phosphatidylinositol 3-kinase (PI3K) Ras effector pathway, increased the levels of PKCdelta protein and activity in cells, whereas inhibition of p21(RAS) activity decreased the expression of the PKCdelta protein. Activation of the Akt survival pathway by oncogenic Ras required PKCdelta activity. Akt activity was dramatically decreased after PKCdelta suppression in cells containing activated p21(RAS). Conversely, constitutively activated Akt rescued cells from apoptosis induced by PKCdelta inhibition. Collectively, these findings demonstrate that p21(RAS), through its downstream effector PI3K, induces PKCdelta expression and that this increase in PKCdelta activity, acting through Akt, is required for cell survival. The p21(RAS) effector molecule responsible for the initiation of the apoptotic signal after suppression of PKCdelta activity was also determined to be PI3K. PI3K (p110(C)(AAX), where AA is aliphatic amino acid) was sufficient for induction of apoptosis after PKCdelta inhibition. Thus, the same p21(RAS) effector, PI3K, is responsible for delivering both a pro-apoptotic signal and a survival signal, the latter being mediated by PKCdelta and Akt. Selective suppression of PKCdelta activity and consequent induction of apoptosis is a potential strategy for targeting of tumor cells containing an activated p21(RAS).


Figures

Figure 1
Figure 1
Effects of isozyme-specific and non-specific PKC inhibitors on proliferation or apoptosis of mouse fibroblast cells and human pancreatic carcinoma cells with wild-type or activated p21Ras. Cells were grown to 80% confluence in 96-well plates, then treated with the inhibitors at the concentrations indicated in Table 1. The corresponding solvents at equivalent volumes were used as vehicle controls. After 48 h treatment, cell growth was evaluated by MTT assay or FACS. Results are presented as the means ± SD. Statistical significance was determined using a paired Student’s t-test, and p-values <0.05 were considered significant (*, p<0.01). (A) p21Ras-specific suppression of growth by PKCδ inhibition. Human pancreatic carcinoma cell cultures (Hs766T [wild-type p21Ras] and MiaPaCa-2 [activated p21Ras] were treated with different doses of rottlerin, and cell growth assayed by MTT assay. (B) Assay of cellular p21Ras activity. Nuclear-free lysates containing a total of 400 µg protein from each indicated cell type were used for analysis of Ras activity by Raf-RBD pull-down. Equal loading was demonstrated by re-probing the blot with anti-β-actin Ab. Pan-Ras protein expression levels were also analyzed. Lanes 1 to 6 represent: Balb, KBalb, NIH/3T3, NIH/3T3-Ras, BxPc-3 and MIA PaCa-2 cells respectively. (C) Growth of NIH/3T3 and NIH/3T3-Ras cells treated with isozyme-specific and non-specific PKC inhibitors. (D) Growth of Hs766T and MIA PaCa-2 cells treated with isozyme-specific and non-specific PKC inhibitors. (E) Nuclear DNA content of cells after inhibition of PKCδ. After 60 h treatment with rottlerin, cells were fixed and stained with propidium iodide, and the apoptotic (hypodiploid) fractions (M1 fractions) were evaluated by flow cytometry. Counts refers to cell numbers; FLH2 is a log scale of fluorescence channels. Similar results were observed in three independent experiments.
Figure 2
Figure 2
Effects of rottlerin on PKCδ and PKCα enzyme activity and protein levels. (A) PKCδ and (B) PKCα kinase activities. The indicated cell lines were treated with rottlerin (20 µM) for 48 h, then harvested for analysis. 400 µg of protein lysates were used for immunoprecipitation by isozyme-specific antibodies, and the immunopurified proteins were assayed using an artificial substrate. (C) PKCδ activity measured by in vitro assay. PKCδ was pulled down from cell lysates by IP and treated with rottlerin (20 µM) for 4 h, and then subjected to an in vitro kinase assay. (D) PKCδ protein levels in cells after rottlerin treatment. 40 µg aliquots of the same protein lysates used in the studies in panels A and B were separated and immunoblotted using an anti-PKCδ monoclonal antibody. Ratio: refers to the value of PKCδ expression/β-actin expression measured by Software BandLead 3.0. (E) PKC isozyme expression levels after treatment with rottlerin. 1×10⁵ cells were plated in each well of a 6-well plate. Cells were treated with rottlerin (20 µM) or with the same volume of vehicle after they reached 80% confluence. After 48 h, cells were harvested, lysed in 50 µl lysis buffer and the lysates separated and subjected to immunoblot analysis using anti-PKC isoform-specific antibodies. Lanes 1 to 4 represent: Balb, KBalb, NIH/3T3 and NIH/3T3-Ras cells respectively. The immunoblots shown in the left and right panels were separated on the same gel and immunoblotted at the same time. Because the samples in the left panel came from untreated cells, whereas the samples in the right panel came from rottlerin-treated cells, and because rottlerin-treatment inhibited cell growth/proliferation, fewer numbers of cells were obtained in these groups, and therefore less protein/lysate was available for assay from the treated group compared to the vehicle control group. The mean activities ±SD were obtained from at least three independent experiments, and assays from immunoprecipitations using an anti-β-actin antibody were used to determine the background activity, which was subtracted. Student’s t-test was used for statistical analysis. (*, p <0.01; ♦, p <0.001).
Figure 3
Figure 3
Effect of PKCδ inhibition on the viability of cells expressing activated p21Ras. (A) Immunoblot analysis of PKCδ, PKCα or β-actin expression in NIH/3T3-Ras and MIA PaCa-2 cells transfected with PKCδ siRNA-1 or -2. A total of 50 nM of PKCδ siRNAs were used. Transfections with a scrambled siRNA or with vehicle alone were used as negative controls. In all experiments, transfections with scrambled siRNA or with vehicle alone yielded identical results, and in subsequent experiments only the scrambled siRNA transfection control is shown. (B) Knock-down activity of PKCα siRNA or scrambled siRNA (control) on NIH/3T3 (lanes 1 and 2) and NIH/3T3-Ras cells (lane 3) evaluated by immunoblotting cell lysates for PKCα or β-actin. NIH/3T3-Ras (C) and MIA PaCa-2 (D) were transfected with pRNA-U6.1-GFP scrambled siRNA hairpin vector (control) or pRNA-U6.1-GFP-PKCδ siRNA-2 hairpin vector. After 72 h, apoptosis was detected by TUNEL assay. NIH/3T3 and BxPc-3 were used as control cell lines, respectively. Shown are 200x magnifications. MIA PaCa-2 cells (E) and NIH/3T3-Ras cells (F) were transfected with a dominant-negative, kinase-dead PKCδ vector. After 72 h, apoptosis was detected by TUNEL assay. BxPc-3 and NIH/3T3 were used as control cell lines (respectively). Shown are 200x magnifications. (G) NIH/3T3 and NIH/3T3-Ras cells were co-transfected with PKD-PKCα siRNA and pEGFP or scrambled siRNA and pGEFP. After 72 h, apoptotic cells were assayed by TUNEL reagent. (H) Quantitation of apoptotic cells in the transfected populations, with error bars indicating SD. Top panel: PKCδ siRNA; middle panel: PKCδ-KR; bottom panel: PKCα siRNA. Data shown are representative of at least three independent experiments.
Figure 3
Figure 3
Effect of PKCδ inhibition on the viability of cells expressing activated p21Ras. (A) Immunoblot analysis of PKCδ, PKCα or β-actin expression in NIH/3T3-Ras and MIA PaCa-2 cells transfected with PKCδ siRNA-1 or -2. A total of 50 nM of PKCδ siRNAs were used. Transfections with a scrambled siRNA or with vehicle alone were used as negative controls. In all experiments, transfections with scrambled siRNA or with vehicle alone yielded identical results, and in subsequent experiments only the scrambled siRNA transfection control is shown. (B) Knock-down activity of PKCα siRNA or scrambled siRNA (control) on NIH/3T3 (lanes 1 and 2) and NIH/3T3-Ras cells (lane 3) evaluated by immunoblotting cell lysates for PKCα or β-actin. NIH/3T3-Ras (C) and MIA PaCa-2 (D) were transfected with pRNA-U6.1-GFP scrambled siRNA hairpin vector (control) or pRNA-U6.1-GFP-PKCδ siRNA-2 hairpin vector. After 72 h, apoptosis was detected by TUNEL assay. NIH/3T3 and BxPc-3 were used as control cell lines, respectively. Shown are 200x magnifications. MIA PaCa-2 cells (E) and NIH/3T3-Ras cells (F) were transfected with a dominant-negative, kinase-dead PKCδ vector. After 72 h, apoptosis was detected by TUNEL assay. BxPc-3 and NIH/3T3 were used as control cell lines (respectively). Shown are 200x magnifications. (G) NIH/3T3 and NIH/3T3-Ras cells were co-transfected with PKD-PKCα siRNA and pEGFP or scrambled siRNA and pGEFP. After 72 h, apoptotic cells were assayed by TUNEL reagent. (H) Quantitation of apoptotic cells in the transfected populations, with error bars indicating SD. Top panel: PKCδ siRNA; middle panel: PKCδ-KR; bottom panel: PKCα siRNA. Data shown are representative of at least three independent experiments.
Figure 4
Figure 4
Inhibition of PKCδ induces the cleavage of caspase-3 and caspase-9 in cells expressed activated p21Ras. All the cells were treated with 20 µM rottlerin for 60 h. Thereafter, cells were harvested, and cell lysates were prepared and subjected to immunoblot analysis to detect the levels of caspase-3/cleaved caspase-3 (A) and caspase-9/cleaved caspase-9 (B) and β-actin. A representative blot from duplicate experiments, producing similar results, is shown.
Figure 5
Figure 5
Activation of apoptosis by individual p21Ras-effector pathways. (A) NIH/3T3 cell lines stably expressing the p21Ras downstream effectors Raf-22W (Raf-1), P110-CAAXC (PI3K), RIF-CAAX (RIF), or RalA-28N (as a negative control) were treated with rottlerin (20 µM) for 60 h and analyzed for the apoptotic fraction. (B) immunoblot analysis of Akt and p-Akt expression in NIH/3T3, NIH/3T3-Ras and NIH/3T3-p110CAAX cells after 48 h treatment with 10 µM LY294002. (C) Erk1/2 and p-Erk1/2 expression in Balb and KBalb cells after 48 h treatment with 10 µM PD98095. The left and right sides of immunoblot 5B and of immunoblot 5C were separated on the same gels, transferred to the same filters and immunoblotted together. (D) Suppression of apoptosis by inhibition of PI3K activity. NIH/3T3 cells stably expressed p110-CAAX were pre-treated for 30 minutes with Ly294002 (10 µM) before rottlerin (20 µM) was added. The apoptotic (hypodiploid) fractions were evaluated 60 h later. (E) KBalb cells were pre-treated with vehicle solvent, LY294002 (10 µM), or PD98095 (10 µM) and then treated with rottlerin (20 µM). The apoptotic (hypodiploid) fractions were evaluated 60 h later. Cells were fixed and stained with propidium iodide. DNA fragmentation was analyzed by flow cytometry using the FL2-H channel. Data shown are representative of at least three independent experiments. Yes, (In this revision, gels 5C has been rerun, as requested by Reviewer.)
Figure 6
Figure 6
Regulation of AKT activity by PKCδ. (A) Treatment with rottlerin reduces Akt activity in cells expressing activated Ras. All cells were treated with 20 µM rottlerin for 60 h in 96-well plates. Total Akt and p-Akt levels were assayed using a SuperArray Case ELISA kit (*, p<0.005). (+): treated with 20 µM rottlerin; (−): treated with vehicle (control); (B) pAkt protein levels in MIA PaCa-2 and NIH/3T3-Ras cells, assayed by immunoblotting with an antibody specific for phosphorylated serine473 Akt, or for total Akt, or for β-actin. Both cell lines were transfected with pEGFP and with pEF1α empty vector, or pEF1α-cAKT, or pEF1α-vAkt. GFP expression was used to normalize for transfection efficiency. (C & D) Activated Akt rescues cells from apoptosis induced by PKCδ knock-down. MIA PaCa-2 and NIH/3T3-Ras cells were cultured on 4-well chamber slides and were co-transfected with pRNA-U6.1-GFP-PKCδ hairpin vector and with pEF1α-vAkt or pEF1α-cAkt vectors. The PKCδ-hairpin vector efficiently suppressed PKCδ levels in these experiments by at least 85% (e.g., see Fig. 3A). After 72 h, cells were fixed with 4% paraformaldehyde for 1 h at room temperature, and then subjected to TUNEL assay. Shown are 200x magnifications. (E) Quantitation of apoptotic cells in the transfected populations (*, p < 0.001). (F) Immunoblot of lysates from Balb or KBalb cells treated with PKCδ-specific siRNA or scrambled, control siRNA. Antibodies against PKCδ, total Akt, phospho-serine473 Akt, and β-actin were used. The results are representative of at least two independent experiments.
Figure 6
Figure 6
Regulation of AKT activity by PKCδ. (A) Treatment with rottlerin reduces Akt activity in cells expressing activated Ras. All cells were treated with 20 µM rottlerin for 60 h in 96-well plates. Total Akt and p-Akt levels were assayed using a SuperArray Case ELISA kit (*, p<0.005). (+): treated with 20 µM rottlerin; (−): treated with vehicle (control); (B) pAkt protein levels in MIA PaCa-2 and NIH/3T3-Ras cells, assayed by immunoblotting with an antibody specific for phosphorylated serine473 Akt, or for total Akt, or for β-actin. Both cell lines were transfected with pEGFP and with pEF1α empty vector, or pEF1α-cAKT, or pEF1α-vAkt. GFP expression was used to normalize for transfection efficiency. (C & D) Activated Akt rescues cells from apoptosis induced by PKCδ knock-down. MIA PaCa-2 and NIH/3T3-Ras cells were cultured on 4-well chamber slides and were co-transfected with pRNA-U6.1-GFP-PKCδ hairpin vector and with pEF1α-vAkt or pEF1α-cAkt vectors. The PKCδ-hairpin vector efficiently suppressed PKCδ levels in these experiments by at least 85% (e.g., see Fig. 3A). After 72 h, cells were fixed with 4% paraformaldehyde for 1 h at room temperature, and then subjected to TUNEL assay. Shown are 200x magnifications. (E) Quantitation of apoptotic cells in the transfected populations (*, p < 0.001). (F) Immunoblot of lysates from Balb or KBalb cells treated with PKCδ-specific siRNA or scrambled, control siRNA. Antibodies against PKCδ, total Akt, phospho-serine473 Akt, and β-actin were used. The results are representative of at least two independent experiments.
Figure 7
Figure 7
Regulation of PKCδ levels by p21Ras. (A) Immunoblot analysis of PKCδ expression in matched cell line pairs NIH/3T3 and NIH/3T3-Ras; and Balb and Kbalb. Blots were stripped and reprobed for β-actin. (B) (Upper panel) NIH/3T3 cells were transfected with the pSG5-H-ras vector and harvested at the time points indicated. The NIH/3T3-Ras cell line was used as positive control. (Lower panel) The relative levels of PKCδ expression were quantitated by Software BandLead 3.0. (C) Effects of a p21Ras inhibitor and a PI3K inhibitor on PKCδ expression. (Upper panel) NIH/3T3-Ras cells were treated with FPT inhibitor III (100 µM) or with Ly294002 (10 µM) for 48 h, then lysed and subjected to immunoblot assay for PKCδ. Blots were then stripped and reprobed for p21Ras and β-actin. (Lower panel) Quantitative measurement of changes in PKCδ Levels. Data shown are representative of at least three independent experiments (*, p <0.01, and ♦, p < 0.05).
Figure 8
Figure 8
Effect of isolated p21Ras effector pathways on PKC expression. Immunoblots of PKCδ, β-actin, Ras, PKCα, PKCθ, or tubulin in: (A) NIH/3T3-Ras cells or NIH-3T3 cells stably-expressing the indicated Ras downstream effectors or empty vector as control (left panel) and KBalb cells or Balb cells stably-expressing the indicated Ras downstream effectors or empty vector as control (right panel); (B) Balb cells stably-expressing Ras-effector loop mutants; (C & D) Balb cells stably-expressing PI3K catalytic domain p110CAAX or KBalb Cells. A total of 50 µg of protein was separated on a 10% SDS-PAGE for each sample. The results are representative of at least three independent experiments.

Similar articles

Cited by

References

    1. Wiesmuller L, Wittinghofer F. Cell Signal. 1994;6(3):247–267. - PubMed
    1. Adjei AA. J Natl Cancer Inst. 2001;93(14):1062–1074. - PubMed
    1. Downward J. Nat Rev Cancer. 2003;3(1):11–22. - PubMed
    1. Hiraragi H, Michael B, Nair A, Silic-Benussi M, Ciminale V, Lairmore M. J Virol. 2005;79(15):9449–9457. - PMC - PubMed
    1. Thimmaiah KN, Easton J, Huang S, Veverka KA, Germain GS, Harwood FC, Houghton PJ. Cancer Res. 2003;63(2):364–374. - PubMed

Publication types

MeSH terms

Substances