. 2007 May 15;92(10):3541-55.
doi: 10.1529/biophysj.106.099028. Epub 2007 Mar 9.

Ca2+ stores regulate ryanodine receptor Ca2+ release channels via luminal and cytosolic Ca2+ sites

Affiliations

Ca2+ stores regulate ryanodine receptor Ca2+ release channels via luminal and cytosolic Ca2+ sites

Derek R Laver. Biophys J. .

Abstract

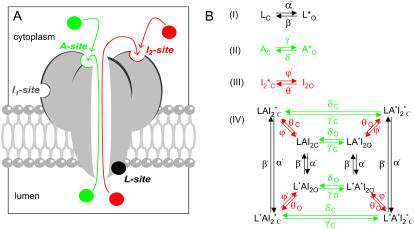
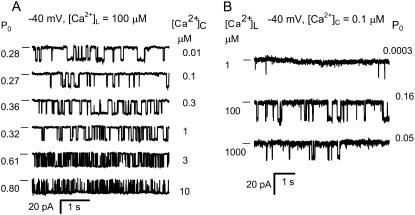
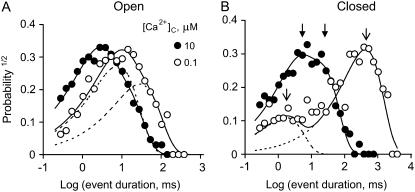
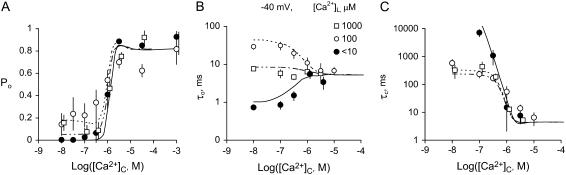
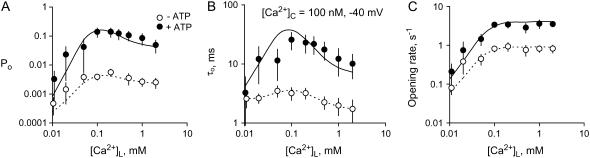
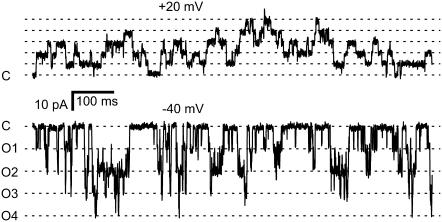
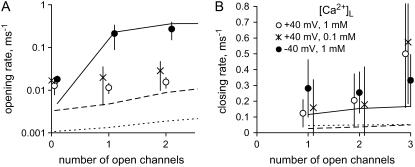
The free [Ca2+] in endoplasmic/sarcoplasmic reticulum Ca2+ stores regulates excitability of Ca2+ release by stimulating the Ca2+ release channels. Just how the stored Ca2+ regulates activation of these channels is still disputed. One proposal attributes luminal Ca2+-activation to luminal facing regulatory sites, whereas another envisages Ca2+ permeation to cytoplasmic sites. This study develops a unified model for luminal Ca2+ activation for single cardiac ryanodine receptors (RyR2) and RyRs in coupled clusters in artificial lipid bilayers. It is shown that luminal regulation of RyR2 involves three modes of action associated with Ca2+ sensors in different parts of the molecule; a luminal activation site (L-site, 60 microM affinity), a cytoplasmic activation site (A-site, 0.9 microM affinity), and a novel cytoplasmic inactivation site (I2-site, 1.2 microM affinity). RyR activation by luminal Ca2+ is demonstrated to occur by a multistep process dubbed luminal-triggered Ca2+ feedthrough. Ca2+ binding to the L-site initiates brief openings (1 ms duration at 1-10 s(-1)) allowing luminal Ca2+ to access the A-site, producing up to 30-fold prolongation of openings. The model explains a broad data set, reconciles previous conflicting observations and provides a foundation for understanding the action of pharmacological agents, RyR-associated proteins, and RyR2 mutations on a range of Ca2+-mediated physiological and pathological processes.


Figures

FIGURE 1
FIGURE 1
The luminal-triggered Ca2+ feedthrough model for [Ca2+]L regulation of RyRs. (A) Schematic of luminal-triggered Ca2+ feedthrough. Ca2+ binding to the L-site causes channel opening whereupon luminal Ca2+ has access to the cytoplasmic Ca2+ activation (A-site) and inactivation sites (I2-site). The I1-site that mediates the low affinity Ca2+/Mg2+ is not included in the model (see text for details). (B) Kinetic schemes for Ca2+ binding at the L-, A-, and I2-sites (Schemes IIII) and the overall scheme (Scheme IV) resulting from the combined action of Ca2+ at all three sites. Schemes IIII are representations of multistep processes. Hence some reaction rates have complex dependencies on [Ca2+] and these are given in the equations listed in Table 1. Asterisks indicate sites occupied with Ca2+. Reaction rates that depend on the Ca2+ current have subscripts o and c to indicate rates associated with open and closed channels, respectively. The open and closed status of the channel associated with each kinetic state is indicated by the subscripts O and C, respectively.
FIGURE 2
FIGURE 2
The effects of [Ca2+]L and [Ca2+]C on the activity of RyR2 (−40 mV). (A) The effect of [Ca2+]C on the activity of a RyR in the presence of 100 μM [Ca2+]L. Increasing [Ca2+]C increases Po in association with a decrease in duration of mean open and closed events. Channel openings are downward current jumps from the baseline (indicated with a dash). (B) The effect of [Ca2+]L on RyR activity in the presence of 0.1 μM [Ca2+]C and 2 mM ATP.
FIGURE 3
FIGURE 3
Dwell-time probability distributions of channel open (A) and closed (B) events. The data are plotted using the log-bin method of Sigworth and Sine (22). Event duration distributions were compiled from a single RyR, which was activated by 2 mM ATP and the indicated [Ca2+]C in the presence of 100 μM [Ca2+]L (−40 mV). An increase in [Ca2+]C from 0.1 to 10 μM shifted both the open and closed distributions to shorter times. Solid curves show double-exponential fits to the data and dashed curves show individual exponential components for the fits to the open circles. When using the log-bin method the exponential components within these distributions appear as peaks centered at their respective time-constants. The arrows in panel B show the time constants associated with the data at 0.1 μM [Ca2+]C (○, open arrows) and 10 μM [Ca2+]C (•, solid arrows).
FIGURE 4
FIGURE 4
The effect of [Ca2+]C on the activity of RyR2 at −40 mV. The values Po, τo, and τc were measured in the presence of 2 mM ATP at [Ca2+]L <10 μM (•), 100 μM (○), or 1000 μM (□). (A) Mean open probability Po mean ± SE. The numbers of experiments and the Hill parameters are listed in Table 2 (Hill fits to the data are not shown). (B, C) The mean ± SE of three-to-eight measurements of τo and τc. The curves [Ca2+]L <10 μM (solid), 100 μM (short dashes), and 100 μM (short/long dashes) show the fit to the data of the luminal-triggered Ca2+ feedthrough model using the parameters in Table 1.
FIGURE 5
FIGURE 5
The [Ca2+]L-dependence of RyR2 Po. (AD) RyRs were activated at the voltage indicated, by 2 mM ATP and 100 nM [Ca2+]C. Data points show the mean ± SE of 3–18 measurements. Solid curves show the fit to the data of the luminal-triggered Ca2+ feedthrough model using the parameters listed in Table 1.
FIGURE 6
FIGURE 6
The effects of membrane potential on the [Ca2+]L-dependent gating of RyR2. (A) Mean channel open times at three membrane voltages and (B) channel opening rates at two voltages. Rates were calculated from the inverse of the mean of closed times. The data points show mean ± SE of 3–14 measurements. In panels A and B, the dashed curves show Hill fits to the data (parameter values plotted in C and D) and the solid curves show the fits of the luminal-triggered Ca2+ feedthrough model using the parameters listed in Table 1. (C) Half-activating and inactivating [Ca2+]L, Ka (•), and Ki (○) for τo. (D) The Ka for RyR opening rate (•) and maximum opening rate (Vmax ○). The Hill coefficient for opening rate was 1.6 ± 0.3. In panels C and D, the solid and dashed curves show the fit to the data of the luminal-triggered Ca2+ feedthrough model. The line (long dashes) shows the voltage-dependence in Ka expected from translocation of Ca2+ through the membrane voltage (i.e., where formula image).
FIGURE 7
FIGURE 7
The effect of [Ca2+]L on closed (A, C, and E) and open (B, D, and F) dwell-time distributions. The data are plotted using the log-bin method of Sigworth and Sine (22). Event duration distributions were compiled from a single RyR, which was activated by cytoplasmic 2 mM ATP (100 nM [Ca2+]C and voltage = −40 mV) and the indicated [Ca2+]L. The data are plotted using log-bins with 3.5 per decade. Solid curves show simulated distributions generated from the luminal-triggered Ca2+ feedthrough model using the parameters listed in Table 1.
FIGURE 8
FIGURE 8
The effect of ATP and [Ca2+]C on the activity of RyR2 at +40 mV. The values Po, τo, and τc were measured in the presence of 2 mM ATP (•) and in its absence (×). (A) Mean open probability Po mean ± SE. The numbers of experiments and the Hill parameters are listed in Table 2 (Hill fits to the data are not shown). (B, C) The mean ± SE of 3–9 measurements of τo and τc. The curves (2 mM ATP, solid; and absence of ATP, dashed) show the fits of the luminal-triggered Ca2+ feedthrough model using the parameters in Table 1.
FIGURE 9
FIGURE 9
The effects of ATP on the [Ca2+]L-dependent gating of RyR2. (A) The open probability of RyRs (100 nM [Ca2+]C and voltage = −40 mV) in the presence of 2 mM ATP (•) and in its absence (○). Also shown are the corresponding τo (B) and opening rates (C). Solid and dashed curves show the fit to the data of the luminal-triggered Ca2+ feedthrough model using the parameters listed in Table 1. The data points show mean ± SE of 3–18 measurements. Hill fits (not shown) to the opening rate reveal that 2 mM ATP increases Vmax from 0.8 ± 0.1 to 4.0 ± 0.4 without significantly changing Ka (Ka = 45 ± 8 μM and 60 ± 20 μM in the absence and presence of ATP, respectively).
FIGURE 10
FIGURE 10
Recordings from an experiment with six RyRs in the bilayer showing coupled gating. At +20 mV (top trace), the channels appeared to gate independently. The dashed lines indicated the current levels associated with various numbers of open channels. The closed current level is labeled C. At −40 mV (bottom trace), the opening of a single channel (transitions from C to O1) was followed closely by openings to higher levels. Only four levels are apparent in this section (labeled O1–O4). The baths contained symmetric 250 mM Cs+ solutions with 2 mM ATP, [Ca2+]C = 100 nM, and [Ca2+]L = 1 mM.
FIGURE 11
FIGURE 11
The dependence of mean channel opening rate (A) and closing rate (B) on the number of open channels. Rates were measured in the presence of 2 mM ATP and 100 nM [Ca2+]C. Opening rates were significantly increased (P < 0.05, t-test) by the presence of other open channels under conditions that favored Ca2+ feedthrough (•, −40 mV [Ca2+]L = 1 mM, six measurements). When Ca2+ feedthrough was relatively low, this did not occur (○, +40 mV [Ca2+]L = 1 mM; ×, −40 mV [Ca2+]L = 0.1 mM, three measurements each). Closing rates did not significantly depend on the presence of other open channels in the bilayer. The data are compared with predictions of the luminal-triggered Ca2+ feedthrough model: •, solid line; ×, long dashes; and ○, dashed line.

References

    1. Stern, M. D., and H. Cheng. 2004. Putting out the fire: what terminates calcium-induced calcium release in cardiac muscle? Cell Calcium. 35:591–601. - PubMed
    1. Coombes, S., R. Hinch, and Y. Timofeeva. 2004. Receptors, sparks and waves in a fire-diffuse-fire framework for calcium release. Prog. Biophys. Mol. Biol. 85:197–216. - PubMed
    1. Fabiato, A., and F. Fabiato. 1977. Calcium release from the sarcoplasmic reticulum. Circ. Res. 40:119–129. - PubMed
    1. Ford, L. E., and R. J. Podolsky. 1972. Calcium uptake and force development by skinned muscle fibers in EGTA buffered solutions. J. Physiol. (Lond.). 223:1–19. - PMC - PubMed
    1. Verkhratsky, A. 2005. Physiology and pathophysiology of the calcium store in the endoplasmic reticulum of neurons. Physiol. Rev. 85:201–279. - PubMed

Publication types

MeSH terms