Comparative Study
. 2007;6(1):2.
doi: 10.1186/jbiol53.

Dosage compensation is less effective in birds than in mammals

Affiliations
Comparative Study

Dosage compensation is less effective in birds than in mammals

Yuichiro Itoh et al. J Biol. 2007.

Abstract

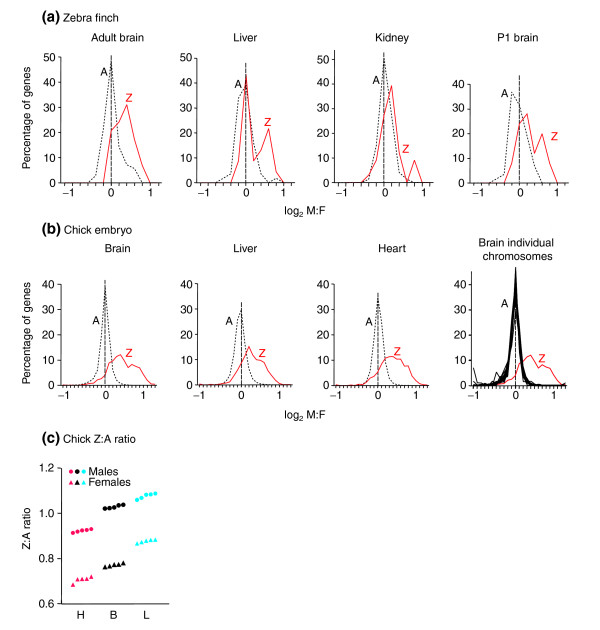
Background: In animals with heteromorphic sex chromosomes, dosage compensation of sex-chromosome genes is thought to be critical for species survival. Diverse molecular mechanisms have evolved to effectively balance the expressed dose of X-linked genes between XX and XY animals, and to balance expression of X and autosomal genes. Dosage compensation is not understood in birds, in which females (ZW) and males (ZZ) differ in the number of Z chromosomes.

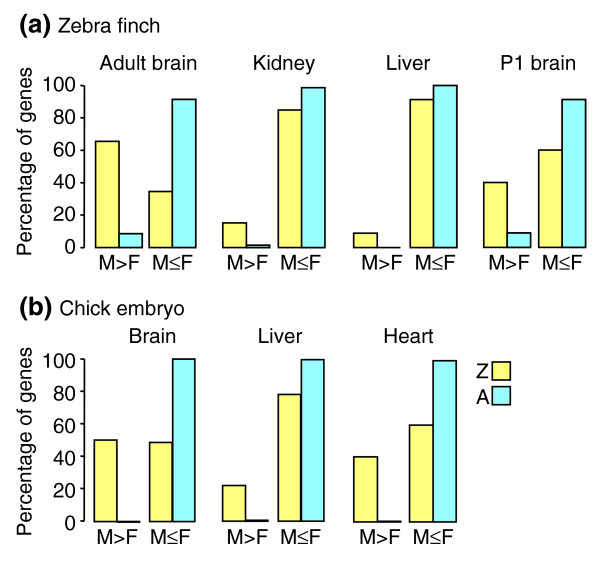
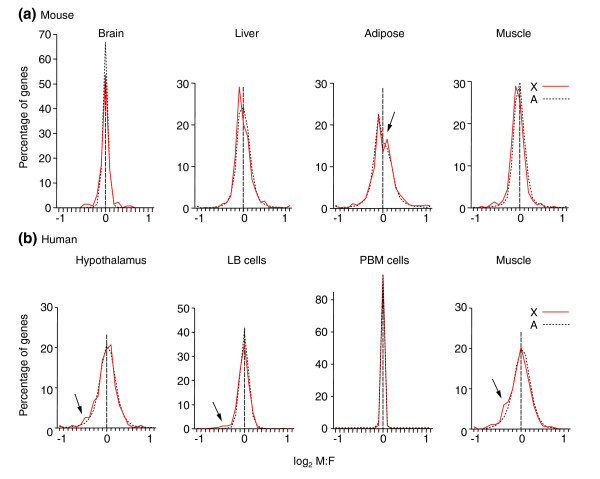
Results: Using microarray analysis, we compared the male:female ratio of expression of sets of Z-linked and autosomal genes in two bird species, zebra finch and chicken, and in two mammalian species, mouse and human. Male:female ratios of expression were significantly higher for Z genes than for autosomal genes in several finch and chicken tissues. In contrast, in mouse and human the male:female ratio of expression of X-linked genes is quite similar to that of autosomal genes, indicating effective dosage compensation even in humans, in which a significant percentage of genes escape X-inactivation.

Conclusion: Birds represent an unprecedented case in which genes on one sex chromosome are expressed on average at constitutively higher levels in one sex compared with the other. Sex-chromosome dosage compensation is surprisingly ineffective in birds, suggesting that some genomes can do without effective sex-specific sex-chromosome dosage compensation mechanisms.


Figures

Figure 1
Figure 1
Distributions of male-to-female (M:F) ratios of gene expression based on microarray studies of birds. (a) M:F ratios in zebra finches, in adult brain, liver, and kidney, and brain of post-hatch day 1 (P1). Autosomal genes (A) are represented by the black dotted line, Z genes (Z) by the red line. The vertical dashed line is centered at a M:F ratio of 1 (log2 ratio of 0). (b) M:F ratios of embryonic chick brain, liver and heart. In each case Z genes are expressed at higher M:F ratios than A genes. In (b) the panel on the far right shows distributions for brain of individual chromosomes containing more than 50 genes. In all panels in (a) and (b) the rightmost bin (at the rightmost mark on the abscissa) includes all genes with M:F ratios at that value or greater, and the leftmost bin includes all genes with M:F ratios at that value or smaller. (c) Z:A ratios of five male and five female chicken samples for heart (H), brain (B) and liver (L).
Figure 2
Figure 2
Comparison of male and female gene expression in birds. The bar graphs compare the percentages of Z (yellow) and A (blue) genes that are expressed at significantly higher levels in males vs females (M > F) or are expressed equally or more highly in females (M ≤ F). Four tissues are shown for zebra finch (a) and three for chick embryo (b). In all tissues, a significantly greater proportion of Z-linked genes, relative to A genes, were expressed at higher levels in males than females.
Figure 3
Figure 3
Comparison of male and female gene expression in mammals. In mouse (a) and humans (b), each tissue has a distinct distribution of M:F ratios, but in each case the distribution for X genes (red line) fits closely to the distribution for A genes (dotted black line). LB, lymphoblastoid cell lines. PBM cells, peripheral blood mononuclear cells. Arrows point to regions where the X and A curves diverge, or to the inflection point in the mouse adipose tissue curve.

Comment in

  • Does gene dosage really matter?
    Graves JA, Disteche CM. Graves JA, et al. J Biol. 2007;6(1):1. doi: 10.1186/jbiol55. J Biol. 2007. PMID: 17381829 Free PMC article. Review.

References

    1. Marin I, Siegal ML, Baker BS. The evolution of dosage-compensation mechanisms. BioEssays. 2000;22:1106–1114. doi: 10.1002/1521-1878(200012)22:12<1106::AID-BIES8>3.0.CO;2-W. - DOI - PubMed
    1. Lucchesi JC, Kelly WG, Panning B. Chromatin remodeling in dosage compensation. Annu Rev Genet. 2005;39:615–631. doi: 10.1146/annurev.genet.39.073003.094210. - DOI - PubMed
    1. Nguyen DK, Disteche CM. Dosage compensation of the active X chromosome in mammals. Nat Genet. 2006;38:47–53. doi: 10.1038/ng1705. - DOI - PubMed
    1. Gupta V, Parisi M, Sturgill D, Nuttall R, Doctolero M, Dudko OK, Malley JD, Eastman PS, Oliver B. Global analysis of X-chromosome dosage compensation. J Biol. 2006;5:3. doi: 10.1186/jbiol30. - DOI - PMC - PubMed
    1. Birchler JA, Fernandez HR, Kavi HH. Commonalities in compensation. BioEssays. 2006;28:565–568. doi: 10.1002/bies.20408. - DOI - PubMed

Publication types