. 2007 May;153(1):48-58.
doi: 10.1016/j.molbiopara.2007.01.018. Epub 2007 Feb 8.

Plasmodium falciparum Na+/H+ exchanger activity and quinine resistance

Affiliations

Plasmodium falciparum Na+/H+ exchanger activity and quinine resistance

Tyler N Bennett et al. Mol Biochem Parasitol. 2007 May.

Abstract

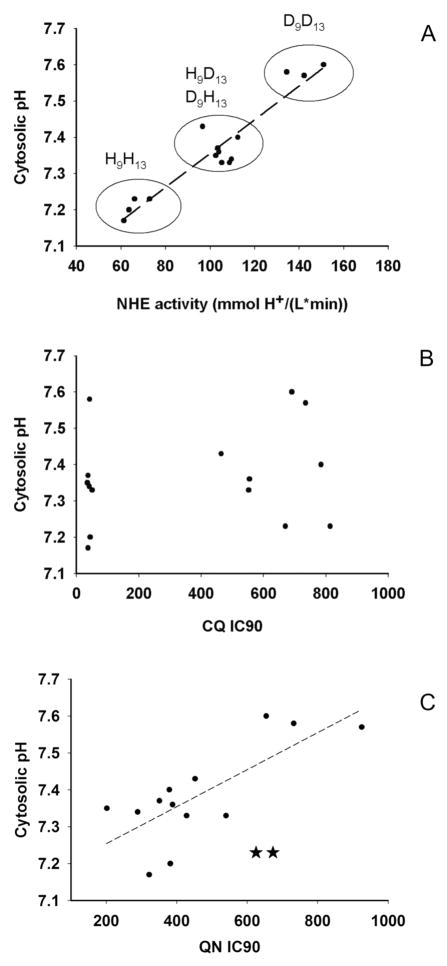
Mutations in the Plasmodium falciparum pfcrt gene cause resistance to the 4-amino quinoline chloroquine (CQ) and other antimalarial drugs. Mutations and/or overexpression of a P. falciparum multidrug resistance gene homologue (pfmdr1) may further modify or tailor the degree of quinoline drug resistance. Recently [Ferdig MT, Cooper RA, Mu JB, et al. Dissecting the loci of low-level quinine resistance in malaria parasites. Mol Microbiol 2004;52:985-97] QTL analysis further implicated a region of P. falciparum chromosome 13 as a partner (with pfcrt) in conferring resistance to the first quinoline-based antimalarial drug, quinine (QN). Since QN resistance (QNR) and CQR are often (but not always) observed together in parasite strains, since elevated cytosolic pH is frequently (but not always) found in CQR parasites, and since the chr 13 segment linked to QNR prominently harbors a gene encoding what appears to be a P. falciparum Na(+)/H(+) exchanger (PfNHE), we have systematically measured cytosolic pH and PfNHE activity for an extended series of parasite strains used in the QTL analysis. Altered PfNHE activity does not correlate with CQR as previously proposed, but significantly elevated PfNHE activity is found for strains with high levels of QNR, regardless their CQR status. We propose that either an elevated pH(cyt) or a higher vacuolar pH-to-cytosolic pH gradient contributes to one common route to malarial QNR that is also characterized by recently defined chr 13-chr 9 pairwise interactions. Based on sequence analysis we propose a model whereby observed polymorphisms in PfNHE may lead to altered Na(+)/H(+) set point regulation in QNR parasites.


Figures

Fig 1
Fig 1
BCECF - AM loading of cells +/− saponin titration. SDCM images of iRBCs stained with 5 uM BCECF - AM (A–C) in the absence of selective membrane permeabilization shows the probe concentrating predominately in the parasitophorous space (ps) and the iRBC cytoplasm, with relatively little fluorescence emanating from the parasite cytoplasm (B). When viewed via SCP methods that collect all light emitted in the z axis sense (D), staining in the spherical ps projects to a circular pattern. A similar image is obtained by adding several consecutive SDCM 0.2 μm “slices” as described in the text (E). In order to localize this probe exclusively to the parasite cytoplasm it is necessary to first treat the iRBCs with 0.03% saponin prior to BCECF loading. SDCM demonstrates that this fluorescence is predominately within the parasite cytoplasm, with little or no fluorescence in the parasite ps, DV or the iRBC cytoplasm (F–H). This allows us to collect fluorescence data via SCP that is exclusively from the parasite cytoplasm (I). Additive “slices” of the SDCM image (G) results in a similar image (J). Scale bars (A,F) are 2 μm and are relevant for all subsequent panels.
Figure 2
Figure 2
Saponin titration of the CQR clone Dd2 loaded with 5 μM BCECF-AM. Treatment of infected RBCs with 0.05% (dotted line), 0.04% (middle thin line) or 0.03% (heavy line) saponin prior to treatment with BCECF-AM leads to varying passive pm H+ permeabilities (high, intermediate, and zero, respectively). Cells are first perfused with physiologically relevant HBSS buffer before switching to perfusate at pH 6.50 with no ionophore (first arrow). PH stability indicates the membrane is “tight” with respect to H+ (heavy trace, 0.03 %). Perfusuate at pH 6.50 and 7.60 and containing 10 μM CCCP (a protonophore that instantly collapses ΔpH) are introduced at the 2nd and 3rd arrows, respectively.
Figure 3
Figure 3
BCECF - AM in situ measurement of pHcyt for CQR (solid line) and CQS (dashed line) saponin-titrated parasites. Initially the cells were perfused with HBSS at 37°C (0 – 180 sec), followed immediately by calibration solutions containing 10 μM CCCP in HBS at pH 7.0, 7.4 and 7.8 (first, second, third arrows), respectively. Calibration in situ overlaps for the two strains indicating probe response is consistent. Each trace represents the average of at least 10 parasites.
Figure 4
Figure 4
Determination of NHE activity in permeabilized iRBCs (strain 7C46). (A) Physiologically relevant buffer (HBSS) is initially perfused until the first arrow, where calibration buffer (HEPES pH 7.40) containing no Na+ (replaced with equimolar NMDG+) and 0.8 uM nigericin is added. The second calibration buffer (MBS, pH 6.4, 0.8 uM nigericin, solution “D”, Table 1) is added at the second arrow. At the third arrow, 10 mg/ml BSA is added to nigericin-free buffer (solution “E”) in order to remove nigericin and “lock” pHcyt at the pHex. At the fourth arrow, either a Na+ free buffer (“B”) or buffer containing sodium (“E”) is added back to the cells. The area in the box highlights alkalization of the parasite cytoplasm in the absence and presence of Na+ and is expanded in (B). The two traces in (B) are subtracted to give (C), the Na+ dependent alkalization of pHcyt after acid load (NHE activity). The first 40 seconds of alkalization is enlarged and fit to a straight line in (D), to compute the rate of NHE activity in pH units/sec (in this example the rate is 0.0156 pH units/sec). Similar experiments using the NH4Cl pulse method (14,25) do not produce reliably stable pHcyt acid pulse (note spontaneous recovery 350 – 450 sec either + or − Na+, panel E) and do not separate Na+ dependent vs. independent components (subtraction between the two produces a nearly flat line (F). All traces represent an average of at least 20 living parasites analyzed individually on a Nikon Diaphot inverted microscope using our custom Single Cell Photometry (SCP) apparatus (11).
Figure 5
Figure 5
Intracellular buffer capacity measured vs. pHi for the CQR clone Dd2 (closed squares) and the CQS clone HB3 (open circles). Cytosolic pH was locked to external pH using the nigericin/BSA method. Buffering capacity was determined at each pHi by pulsing with 25 mM NH4Cl (25). Each point represents the average of at least 10 parasites.
Figure 6
Figure 6
NHE activities for the CQR clone Dd2 (closed squares) and the CQS clone HB3 (open circles) vs. clamped pHi. Each point represents at least 10 parasites +/− s.d.
Figure 7
Figure 7
NHE activity (A), CQ IC90 (B) QN IC90 (C) vs. pHcyt for strains shown in Table 2. Not surprisingly NHE activity is well correlated with relative pHcyt (A; Pearson correlation analysis r = 0.95, p < 0.0001) for all clones analyzed in this study (see Table 2). There is no correlation between CQR and pHcyt across the entire set of clones (B). A strong correlation between QN IC90 and pHcyt (C, Pearson correlation analysis r = 0.82, p < 0.003) is found for 13 of the 15 strains in Table II (solid circles) wherein some level of quinine response is influenced by inheritance of Dd2 chr 9 and/or chr 13 loci (see also pairwise analysis in A and Table II). This correlation is not as strong when we include strains for which QNR is due solely to mutant pfcrt without the added effect of chr 9 and/or chr 13 loci (e.g. strains 7C46 and QC34, which are shown in plot C [star symbols], but not included in the straight line fit).

Comment in

References

    1. Baird JK. Effectiveness of antimalarial drugs. N Engl J Med. 2005;352:1565–77. - PubMed
    1. Snow RW, Guerra CA, Noor AM, Myint HY, Hay SI. The global distribution of clinical episodes of Plasmodium falciparum malaria. Nature. 2005;434:214–7. - PMC - PubMed
    1. Fidock DA, Nomura T, Talley AK, Cooper RA, Dzekunov SM, Ferdig MT, Ursos LMB, Sidhu ABS, Naude B, Deitsch KW, Su XZ, Wootton JC, Roepe PD, Wellems TE. Mutations in the P-falciparum digestive vacuole transmembrane protein PfCRT and evidence for their role in chloroquine resistance. Molecular Cell. 2000;6:861–871. - PMC - PubMed
    1. Cooper RA, Ferdig MT, Su XZ, Ursos LM, Mu J, Nomura T, Fujioka H, Fidock DA, Roepe PD, Wellems TE. Alternative mutations at position 76 of the vacuolar transmembrane protein PfCRT are associated with chloroquine resistance and unique stereospecific quinine and quinidine responses in Plasmodium falciparum. Mol Pharmacol. 2002;61:35–42. - PubMed
    1. Sidhu AB, Valderramos SG, Fidock DA. pfmdr1 mutations contribute to quinine resistance and enhance mefloquine and artemisinin sensitivity in Plasmodium falciparum. Mol Microbiol. 2005;57:913–26. - PubMed

Publication types

MeSH terms