

Two-tone distortion at different longitudinal locations on the basilar membrane
- PMID: 17353104
- PMCID: PMC2041923
- DOI: 10.1016/j.heares.2007.01.026
Two-tone distortion at different longitudinal locations on the basilar membrane
Abstract
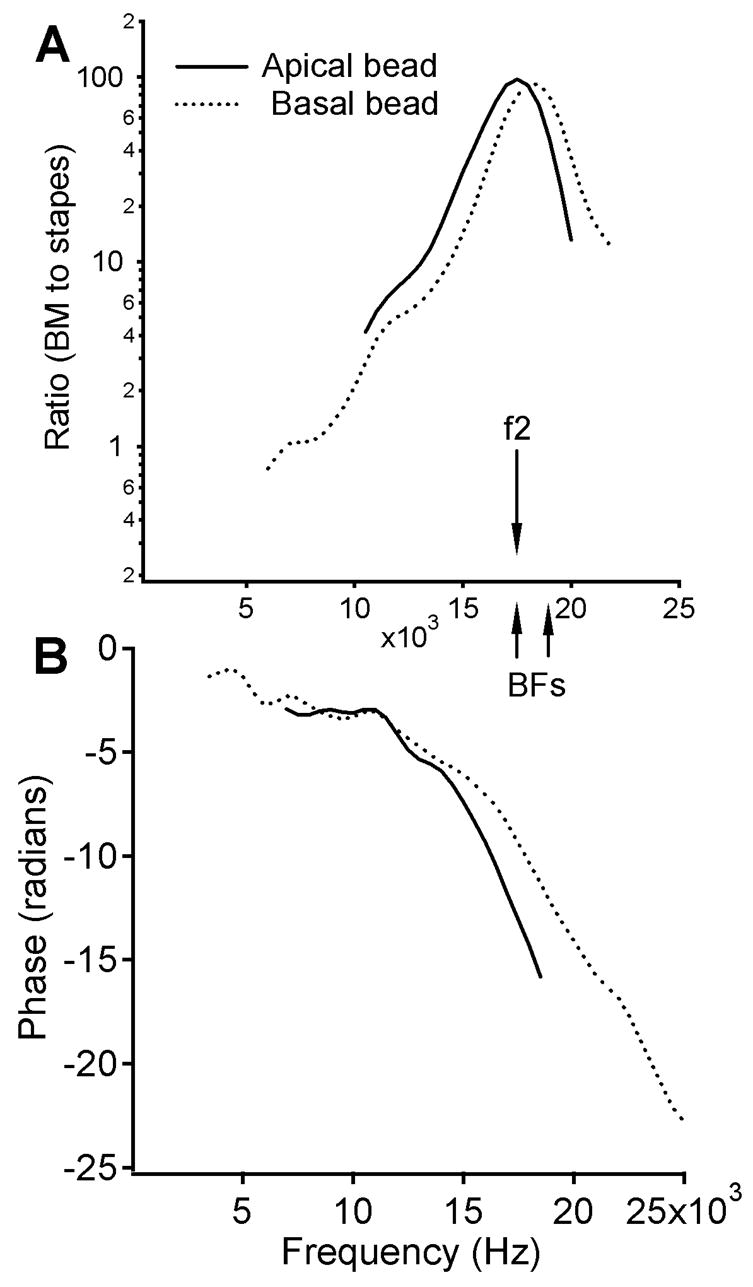
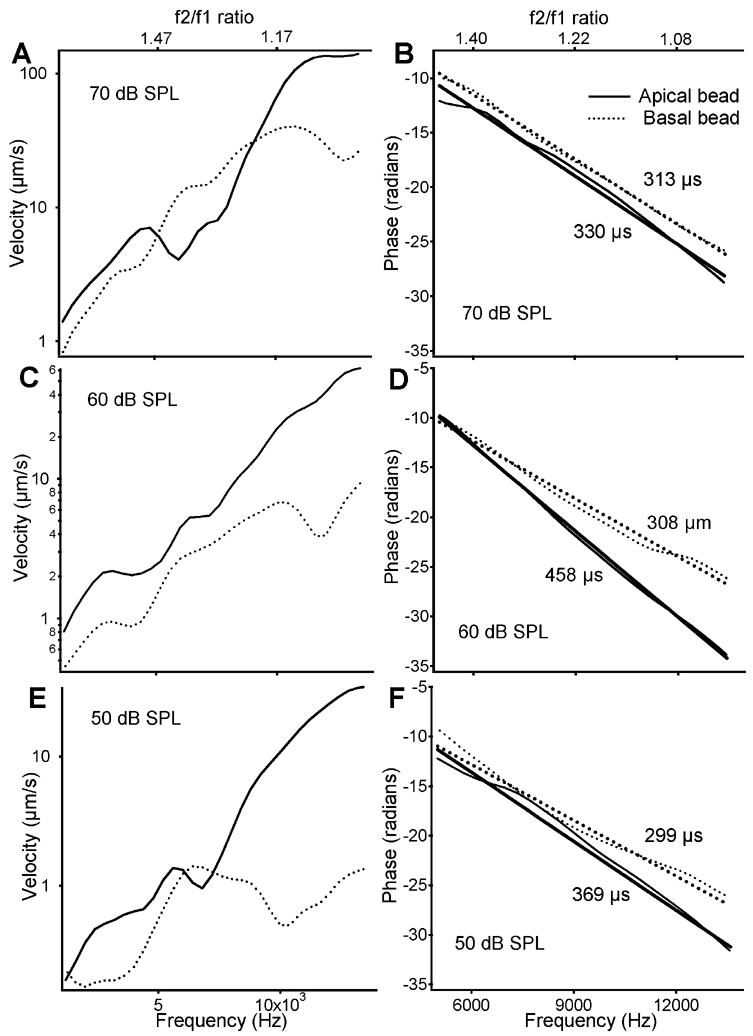
When listening to two tones at frequency f1 and f2 (f2>f1), one can hear pitches not only at f1 and f2 but also at distortion frequencies f2-f1, (n+1)f1-nf2, and (n+1)f2-nf1 (n=1,2,3...). Such two-tone distortion products (DPs) also can be measured in the ear canal using a sensitive microphone. These ear-generated sounds are called otoacoustic emissions (OAEs). In spite of the common applications of OAEs, the mechanisms by which these emissions travel out of the cochlea remain unclear. In a recent study, the basilar membrane (BM) vibration at 2f1-f2 was measured as a function of the longitudinal location, using a scanning laser interferometer. The data indicated a forward traveling wave and no measurable backward wave. However, this study had a relatively high noise floor and high stimulus intensity. In the current study, the noise floor of the BM measurement was significantly decreased by using reflective beads on the BM, and the vibration was measured at relatively low intensities at more than one longitudinal location. The results show that the DP phase at a basal location leads the phase at an apical location. The data indicate that the emission travels along the BM from base to apex as a forward traveling wave, and no backward traveling wave was detected under the current experimental conditions.
Figures


Similar articles
-
Two-tone distortion on the basilar membrane of the chinchilla cochlea.J Neurophysiol. 1997 May;77(5):2385-99. doi: 10.1152/jn.1997.77.5.2385. J Neurophysiol. 1997. PMID: 9163365 Free PMC article.
-
Electrically evoked cubic distortion product otoacoustic emissions from gerbil cochlea.Hear Res. 1996 Dec 1;102(1-2):43-50. doi: 10.1016/s0378-5955(96)00145-1. Hear Res. 1996. PMID: 8951449
-
Distortion product otoacoustic emissions and basilar membrane vibration in the 6-9 kHz region of sensitive chinchilla cochleae.J Acoust Soc Am. 2007 Nov;122(5):2725-37. doi: 10.1121/1.2785034. J Acoust Soc Am. 2007. PMID: 18189565
-
Basilar membrane vibration is not involved in the reverse propagation of otoacoustic emissions.Sci Rep. 2013;3:1874. doi: 10.1038/srep01874. Sci Rep. 2013. PMID: 23695199 Free PMC article.
-
Age-related shifts in distortion product otoacoustic emissions peak-ratios and amplitude modulation spectra.Hear Res. 2015 Sep;327:186-98. doi: 10.1016/j.heares.2015.07.017. Epub 2015 Jul 29. Hear Res. 2015. PMID: 26232530 Free PMC article.
Cited by
-
Reverse wave propagation in the cochlea.Proc Natl Acad Sci U S A. 2008 Feb 19;105(7):2729-33. doi: 10.1073/pnas.0708103105. Epub 2008 Feb 12. Proc Natl Acad Sci U S A. 2008. PMID: 18272498 Free PMC article.
-
Waves on Reissner's membrane: a mechanism for the propagation of otoacoustic emissions from the cochlea.Cell Rep. 2012 Apr 19;1(4):374-84. doi: 10.1016/j.celrep.2012.02.013. Cell Rep. 2012. PMID: 22580949 Free PMC article.
-
Inverse-solution method for a class of non-classical cochlear models.J Acoust Soc Am. 2009 Apr;125(4):2146-54. doi: 10.1121/1.3083240. J Acoust Soc Am. 2009. PMID: 19354390 Free PMC article.
-
The group delay and suppression pattern of the cochlear microphonic potential recorded at the round window.PLoS One. 2012;7(3):e34356. doi: 10.1371/journal.pone.0034356. Epub 2012 Mar 28. PLoS One. 2012. PMID: 22470560 Free PMC article.
-
Modelling cochlear mechanics.Biomed Res Int. 2014;2014:150637. doi: 10.1155/2014/150637. Epub 2014 Jul 23. Biomed Res Int. 2014. PMID: 25136555 Free PMC article. Review.
References
-
- Avan P, Magnan P, Smurzynski J, Probst R, Dancer A. Direct evidence of cubic difference tone propagation by intracochlear acoustic pressure measurements in the guinea-pig. Eur J Neurosci. 1998;10:1764–70. - PubMed
-
- Cooper NP. Vibration of beads placed on the basilar membrane in the basal turn of the cochlea [letter] J Acoust Soc Am. 1999;106:L59–64. - PubMed
-
- Cooper NP, Rhode WS. Mechanical responses to two-tone distortion products in the apical and basal turns of the mammalian cochlea. J Neurophysiol. 1997;78:261–70. - PubMed
-
- Cooper NP, Shera CA. Backward traveling waves in the cochlea? Comparing basilar membrane vibrations and otoacoustic emissions from Individual guinea-pig ears. Association for Research in Otolaryngology Twenty-seventh Midwinter Research Meeting; Daytona Beach, Florida,. 2004. p. 342.
Publication types
MeSH terms
Grants and funding
LinkOut - more resources
Full Text Sources
Research Materials
Miscellaneous
