

Hierarchical classification of functionally equivalent genes in prokaryotes
- PMID: 17353185
- PMCID: PMC1874638
- DOI: 10.1093/nar/gkl1114
Hierarchical classification of functionally equivalent genes in prokaryotes
Abstract
Functional classification of genes represents a fundamental problem to many biological studies. Most of the existing classification schemes are based on the concepts of homology and orthology, which were originally introduced to study gene evolution but might not be the most appropriate for gene function prediction, particularly at high resolution level. We have recently developed a scheme for hierarchical classification of genes (HCGs) in prokaryotes. In the HCG scheme, the functional equivalence relationships among genes are first assessed through a careful application of both sequence similarity and genomic neighborhood information; and genes are then classified into a hierarchical structure of clusters, where genes in each cluster are functionally equivalent at some resolution level, and the level of resolution goes higher as the clusters become increasingly smaller traveling down the hierarchy. The HCG scheme is validated through comparisons with the taxonomy of the prokaryotic genomes, Clusters of Orthologous Groups (COGs) of genes and the Pfam system. We have applied the HCG scheme to 224 complete prokaryotic genomes, and constructed a HCG database consisting of a forest of 5339 multi-level and 15 770 single-level trees of gene clusters covering approximately 93% of the genes of these 224 genomes. The validation results indicate that the HCG scheme not only captures the key features of the existing classification schemes but also provides a much richer organization of genes which can be used for functional prediction of genes at higher resolution and to help reveal evolutionary trace of the genes.
Figures

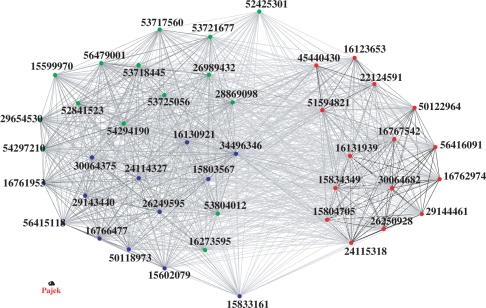
 ), cheY (
 ), spo0A (
 ) spo0F (
 ), and genes without further specifications (▪). Each dotted ellipse contains genes that form a cluster via the guilty-by-association rule when a certain percentage of insignificant (bottom) edges are removed, where an edge is less significant if it is associated with a higher BLASTP e-value. See Figure S-1 in the Supplementary Data for additional information of these genes and their functional equivalence relationships.


Similar articles
-
On application of directons to functional classification of genes in prokaryotes.Comput Biol Chem. 2008 Jun;32(3):176-84. doi: 10.1016/j.compbiolchem.2008.02.007. Epub 2008 Mar 2. Comput Biol Chem. 2008. PMID: 18440870
-
Genome alignment, evolution of prokaryotic genome organization, and prediction of gene function using genomic context.Genome Res. 2001 Mar;11(3):356-72. doi: 10.1101/gr.gr-1619r. Genome Res. 2001. PMID: 11230160
-
Clusters of orthologous genes for 41 archaeal genomes and implications for evolutionary genomics of archaea.Biol Direct. 2007 Nov 27;2:33. doi: 10.1186/1745-6150-2-33. Biol Direct. 2007. PMID: 18042280 Free PMC article.
-
Comparative Genomics for Prokaryotes.Methods Mol Biol. 2018;1704:55-78. doi: 10.1007/978-1-4939-7463-4_3. Methods Mol Biol. 2018. PMID: 29277863 Review.
-
Advantages and limitations of genomics in prokaryotic taxonomy.Clin Microbiol Infect. 2013 Sep;19(9):790-5. doi: 10.1111/1469-0691.12181. Epub 2013 Mar 13. Clin Microbiol Infect. 2013. PMID: 23490121 Review.
Cited by
-
HGD: an integrated homologous gene database across multiple species.Nucleic Acids Res. 2023 Jan 6;51(D1):D994-D1002. doi: 10.1093/nar/gkac970. Nucleic Acids Res. 2023. PMID: 36318261 Free PMC article.
References
-
- Tatusov RL, Koonin EV, Lipman DJ. A genomic perspective on protein families. Science. 1997;278:631–637. - PubMed
-
- Dufayard JF, Duret L, Penel S, Gouy M, Rechenmann F, Perriere G. Tree pattern matching in phylogenetic trees: automatic search for orthologs or paralogs in homologous gene sequence databases. Bioinformatics. 2005;21:2596–2603. - PubMed
-
- Storm CE, Sonnhammer EL. Automated ortholog inference from phylogenetic trees and calculation of orthology reliability. Bioinformatics. 2002;18:92–99. - PubMed
Publication types
MeSH terms
Substances
LinkOut - more resources
Full Text Sources
Other Literature Sources
