. 2007 May;27(10):3839-3854.
doi: 10.1128/MCB.01662-06.

Differential regulation of Foxo3a target genes in erythropoiesis

Affiliations

Differential regulation of Foxo3a target genes in erythropoiesis

Walbert J Bakker et al. Mol Cell Biol. 2007 May.

Abstract

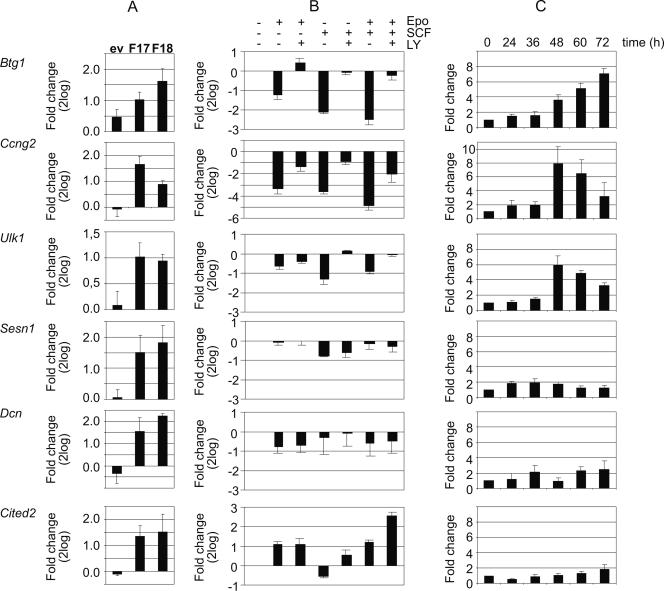
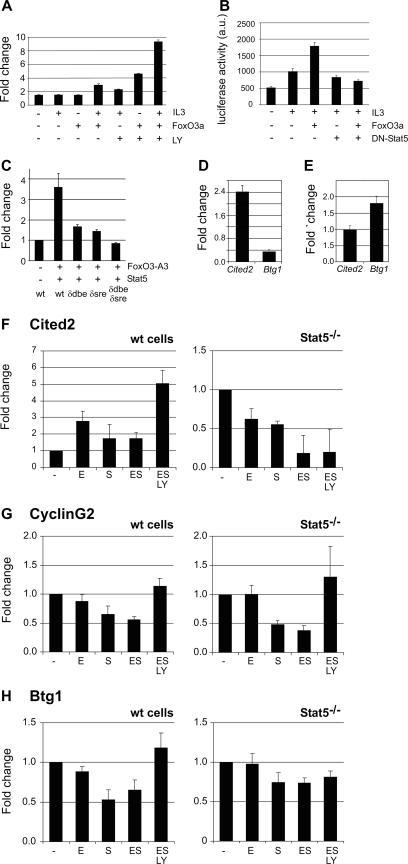
The cooperation of stem cell factor (SCF) and erythropoietin (Epo) is required to induce renewal divisions in erythroid progenitors, whereas differentiation to mature erythrocytes requires the presence of Epo only. Epo and SCF activate common signaling pathways such as the activation of protein kinase B (PKB) and the subsequent phosphorylation and inactivation of Foxo3a. In contrast, only Epo activates Stat5. Both Foxo3a and Stat5 promote erythroid differentiation. To understand the interplay of SCF and Epo in maintaining the balance between renewal and differentiation during erythroid development, we investigated differential Foxo3a target regulation by Epo and SCF. Expression profiling revealed that a subset of Foxo3a targets was not inhibited but was activated by Epo. One of these genes was Cited2. Transcriptional control of Epo/Foxo3a-induced Cited2 was studied and compared with that of the Epo-repressed Foxo3a target Btg1. We show that in response to Epo, the allegedly growth-inhibitory factor Foxo3a associates with the allegedly growth-stimulatory factor Stat5 in the nucleus, which is required for Epo-induced Cited2 expression. In contrast, Btg1 expression is controlled by the cooperation of Foxo3a with cyclic AMP- and Jun kinase-dependent Creb family members. Thus, Foxo3a not only is an effector of PKB but also integrates distinct signals to regulate gene expression in erythropoiesis.


Figures

FIG. 1.
FIG. 1.
Dendrogram of Foxo3a target genes and their regulation by Epo, SCF, and Dex. I/11 cells expressing Foxo3a(A3):ER or a control vector were treated with or without 4OHT (50 nM) for 6 h under expansion conditions (Epo/SCF/Dex). cDNAs were hybridized to 17K EST arrays in pairs using dual labeling with fluorochromes. Genes were selected when 4OHT induced or repressed expression >1.75-fold in Foxo3a(A3):ER-expressing cells (ratio of plus 4OHT/minus 4OHT, “Foxo3a′”) and <1.3-fold in control cells (ratio of plus 4OHT/minus 4OHT, “EV”). These genes were clustered with data on the regulation of these genes by Epo (E), SCF (S), Epo/SCF (ES), Epo/SCF/Dex (ESD), Epo/SCF/2k112.993 (ES2k), and Dex (D) by Spotfire software using Euclidean distance and average linkage to assess distance. Five major clusters of target genes (A to E) are indicated on the left side. Black ovals indicate the branches of the distinct clusters. Red indicates upregulation, and green indicates repression by 4OHT or growth factors. The original data as well as genes and values corresponding to this graph are presented in the supplemental material.
FIG. 2.
FIG. 2.
Expression of Foxo3a target genes in response to growth factors and during differentiation of erythroblasts. (A) Independent Foxo3a(A3):ER-overexpressing clones and control clones were treated with 50 nM 4OHT for 2 h. The expression ratio (2-log values) of plus 4OHT/minus 4OHT is shown for selected target genes, indicated at the left side of the panels, in the control clone (ev) and Foxo3a(A3):ER clones F17 and F18. (B) I/11 cells were factor deprived and subsequently stimulated for 2 h with Epo, SCF, or Epo plus SCF in the presence or absence of the PI3K inhibitor LY294002 (LY) (15 μM). The expression ratio (2-log values) of various conditions over factor-deprived cells is shown for the selected target genes. (C) I/11 cells were differentiated, and samples were taken every 12 h until the end of erythroid differentiation (72 h). Transcript levels from the selected genes were compared between the start of the differentiation experiment (arbitrarily set at 1) and ensuing time points. In all experiments, transcript levels were determined using poly(A) mRNA and real-time PCR. Bars indicate the averages of at least three experiments, and error bars indicate standard deviations.
FIG. 3.
FIG. 3.
Epo induces Foxo3a-Stat5 complex formation. (A) I/11 erythroblasts were factor deprived (4 h) and restimulated with Epo (E) (20 min with 5 U/ml), SCF (S) (20 min with 200 ng/ml), or both (ES) as indicated below the blots. Stat5 was immunoprecipitated from whole-cell and nuclear extracts and stained for Foxo3a (upper panels) and Stat5 (lower panels). (B and C) I/11 erythroblasts were factor deprived and restimulated with Epo (E) or with Epo plus SCF (ES) for the indicated times (minutes). (B) Western blots (WB) containing total cytoplasmic (C) and nuclear (N) extracts were stained for Foxo3a. The low-mobility phosphorylated form (P-Foxo3a) and faster-mobility unphosphorylated form (Foxo3a) of Foxo3a are indicated. (C) Stat5 immunoprecipitates from cytoplasmic (C) or nuclear (N) fractions of Epo-stimulated cells were stained for Foxo3a and Stat5. (D) Schematic representation of the constructed Foxo3a deletion mutants. wt Foxo3a comprises amino acids 1 to 673. The DNA binding domain (Forkhead box) is depicted in gray. The N-terminal mutant lacks the first 243 amino acids, and the C-terminal deletion mutant lacks amino acids 361 to 673. (E) Stat5, wt Foxo3a, and the N-terminal and C-terminal deletion mutants were expressed in 293T cells as indicated. Expression in total cell lysates was checked by staining membranes using a Stat5 and Myc-tagged antibody as indicated. (F) Stat5 immunoprecipitations (IP) from total lysates stained with Stat5 (lower panel). Nonspecific binding was verified by treating total lysate with beads only (lane 2). Stat5 immunoprecipitation blots were stained with Myc-tagged antibody to detect coprecipitating Foxo3a (upper panel, full-length Foxo3a; middle panel, ΔN and ΔC Foxo3a deletion mutants). (G) Anti-Myc-tagged immunoprecipitations from total lysates backstained with Myc antibody (lower panel) or stained with Stat5 antibody (upper panel). Nonspecific binding was verified by treating total lysate with beads only (lane 2).
FIG. 4.
FIG. 4.
Cited2 promoter analysis and ChIP. (A) Alignment of the mouse (upper line) and human (lower line) Cited2 promoters containing the DBE and the SRE (both in boldface type). Positions of these elements are based on promoter A identified in the human CITED2 promoter (47). Primers (F, forward; R, reverse) indicated by arrows were used for ChIP in B and C. (B and C) ChIPs using a Stat5 (B) or Foxo3a (C) antibody were performed in I/11 cells factor deprived for 4 h and subsequently stimulated with Epo for 20 min. An anti-Myc (αmyc) ChIP was used as a negative control, and input DNA represents samples before immunoprecipitation. The DNA ladder shows bands from 100 to 500 bp with 100-bp increments. PCR was used to detect the SRE or DBE in Cited2, Btg1, and Cis as indicated on the right-hand side.
FIG. 5.
FIG. 5.
Foxo3a and Stat5 cooperate to induce Cited2 promoter activity. For promoter studies, Ba/F3 cells were electroporated with Cited2-luciferase constructs (positions −1128 to +269 of the Cited2 promoter) and a β-galactosidase construct to correct for transfection efficiency. Luciferase activity is expressed as arbitrary units (a.u.). (A) Ba/F3 cells were transfected with the Cited2-reporter construct together with wt Foxo3a, where indicated, and grown overnight in the presence of SCF. Subsequently, cells were treated (8 h) with combinations of IL-3 and the PI3K inhibitor LY (15 μM). Luciferase activity is presented as induction (n-fold) compared to Cited2 promoter activity in the presence of SCF only (first lane). (B) Ba/F3 cells were transfected with combinations of the Cited2 promoter, Foxo3a, and dominant-negative Stat5 (mStat5AΔ750). Cells were incubated overnight in the presence or absence of IL-3. (C) Activities of different Cited2 promoter mutants with a mutated DBE (δDBE), a mutated SRE (δSRE), or a double-mutated construct (δDBE/δSRE) relative to that of the wt promoter. Ba/F3 cells were transfected with the different promoters together with Stat5 and Foxo3a-A3 expression constructs grown overnight in the presence of IL-3, after which promoter activity was analyzed. (D) wt Cited2 and Btg1 promoter constructs were transfected into Ba/F3 cells, grown overnight in the presence of SCF alone, and stimulated the next day with IL-3 for 8 h. Luciferase activity is presented as the ratio with IL-3 to that without. (E) As in D, cells were treated the next day with LY294002 (15 μM). (F to H) Primary erythroid progenitors were grown for 6 days from E14 fetal livers derived from Stat5−/− embryos and wt littermates. Cells were factor deprived (−) and restimulated with Epo (E), SCF (S), Epo plus SCF (ES), or Epo plus SCF plus LY294002 (ESLY), as described in the legend of Fig. 2. The expression of Cited2 (F), Cyclin G2 (G), and Btg1 (H) was measured by Q-PCR, and changes (n-fold) were normalized to RNase inhibitor. Values represent means and standard deviations of three experiments.
FIG. 6.
FIG. 6.
Expression of Btg1 is controlled by Foxo3a binding to its specific site (DBE) and by factors binding to a CRE located close to the DBE. (A) Alignment of the mouse and human Btg1 promoters. The putative transcription start site is indicated as +1, and transcribed sequence is in boldface and italic type. The TATA box, the DBE, and the CRE are boxed. (B) Btg1 promoter fragments (wt or containing a mutated DBE, a mutated CRE, or both) were cloned into a luciferase reporter construct and transfected in NIH 3T3 cells, and luciferase activity was measured 24 h after transfection. Values were normalized for transfection efficiency using β-galactosidase activity encoded by a cotransfected expression plasmid. Data are presented as a ratio to the activity of the wt promoter. (C) The wt promoter reporter construct was cotransfected with or without the Foxo3a-A3 expression construct, and cells were treated with db-cAMP (10 μM) overnight. Reporter activity was measured 16 h after transfection. Data are presented as a ratio to the activity of the wt promoter in the absence of Foxo3a or db-cAMP. Values represent means and standard deviations of three experiments.
FIG. 7.
FIG. 7.
The CRE in the Btg1 promoter binds CREB/ATF1 as well as c-Jun/ATF2. (A) I/11 cells were factor deprived (4 h) and stimulated with db-cAMP (db) (10 μM), prostaglandin E2 (E2) (10 μM), or norepinephrine (NE) (100 μM) for 5, 10, or 20 min. Cytoplasmic and nuclear extracts were prepared and stained with an antibody recognizing phosphorylated serines 133 and 63 in CREB and ATF1, respectively. (B) Intracellular cAMP levels were determined using a cAMP enzyme immunoassay. (C) I/11 cells were induced to differentiate, and cytoplasmic and nuclear extracts were generated at 24-h intervals and stained with an antibody recognizing phosphorylated serines 133 and 63 in CREB and ATF1, respectively. As a loading control, the same blot was stained for total CREB/ATF1. (D and E) Nuclear extracts from expanding (D) and 48-h-differentiated (E) I/11 cells were incubated with a 32P-labeled oligonucleotide probe derived from the Btg1 promoter encompassing the CRE. Binding of protein complexes was assessed by EMSA. To verify specific binding, we added 10- and 100-fold excesses of oligonucleotide probe: wt (wt CRE) (lanes 2 and 3) or a mutated CRE (mut-CRE) (lanes 4 and 5). To identify the protein complexes, an excess of a CREB/ATF1-specific (CREB oligo) (lanes 6 and 7) or a c-Jun/ATF2-specific (ATF2 oligo) (lanes 8 and 9) oligonucleotide probe was added. In supershift experiments, anti-CREB/ATF1 (lane 11) or anti-Stat5 (lane 12) was added. Arrows at the right-hand side indicate the mobility of c-Jun/ATF2 and CREB/ATF1 complexes.

Similar articles

Cited by

References

    1. Abdel-Wahab, N., S. J. Wicks, R. M. Mason, and A. Chantry. 2002. Decorin suppresses transforming growth factor-beta-induced expression of plasminogen activator inhibitor-1 in human mesangial cells through a mechanism that involves Ca2+-dependent phosphorylation of Smad2 at serine-240. Biochem. J. 362:643-649. - PMC - PubMed
    1. Andrews, N. C., H. Erdjument-Bromage, M. B. Davidson, P. Tempst, and S. H. Orkin. 1993. Erythroid transcription factor NF-E2 is a haematopoietic-specific basic-leucine zipper protein. Nature 362:722-728. - PubMed
    1. Andrews, N. C., and D. V. Faller. 1991. A rapid micropreparation technique for extraction of DNA-binding proteins from limiting numbers of mammalian cells. Nucleic Acids Res. 19:2499. - PMC - PubMed
    1. Bakker, W. J., M. Blazquez-Domingo, A. Kolbus, J. Besooyen, P. Steinlein, H. Beug, P. J. Coffer, B. Lowenberg, M. Von Lindern, and T. B. Van Dijk. 2004. FoxO3a regulates erythroid differentiation and induces BTG1, an activator of protein arginine methyl transferase 1. J. Cell Biol. 164:175-184. - PMC - PubMed
    1. Bamforth, S. D., J. Braganca, C. R. Farthing, J. E. Schneider, C. Broadbent, A. C. Michell, K. Clarke, S. Neubauer, D. Norris, N. A. Brown, R. H. Anderson, and S. Bhattacharya. 2004. Cited2 controls left-right patterning and heart development through a Nodal-Pitx2c pathway. Nat. Genet. 36:1189-1196. - PubMed

Publication types

MeSH terms