

Changes in fiber integrity, diffusivity, and metabolism of the pyramidal tract adjacent to gliomas: a quantitative diffusion tensor fiber tracking and MR spectroscopic imaging study
- PMID: 17353313
- PMCID: PMC7977820
Changes in fiber integrity, diffusivity, and metabolism of the pyramidal tract adjacent to gliomas: a quantitative diffusion tensor fiber tracking and MR spectroscopic imaging study
Abstract
Background and purpose: The underlying changes in the neuronal connectivity adjacent to brain tumors cannot always be depicted by conventional MR imaging. The hypothesis of this study was that preoperative sensorimotor deficits are associated with impairment in pyramidal fiber bundles. Hence, we investigated the potential of combined quantitative diffusion tensor (DT) fiber tracking and MR spectroscopic imaging (MRSI) to determine changes in the pyramidal tract adjacent to gliomas.
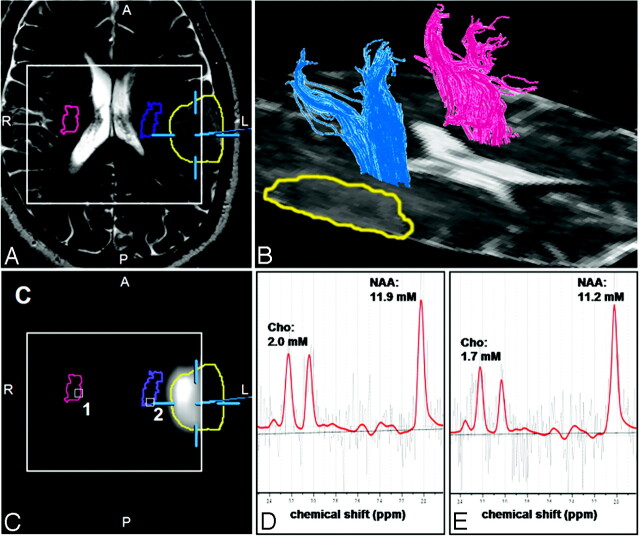
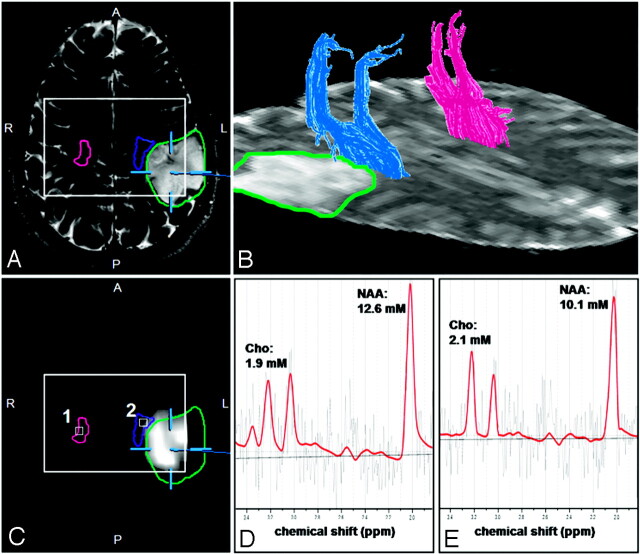
Materials and methods: Quantitative DT fiber tracking and proton MRSI were performed in 20 patients with gliomas with WHO grades II-IV. Eight patients experienced preoperative sensorimotor deficits. Mean diffusivity (MD), fractional anisotropy (FA), and number of fibers per voxel (FpV) were calculated for the pyramidal tract of the ipsilateral and contralateral hemisphere. Metabolite concentrations for choline-containing compounds (Cho), creatine (Cr), and N-acetylaspartate (NAA) were computed, using LCModel, for all voxels located at the pyramidal tracts.
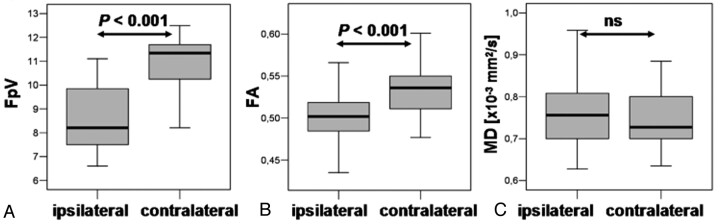
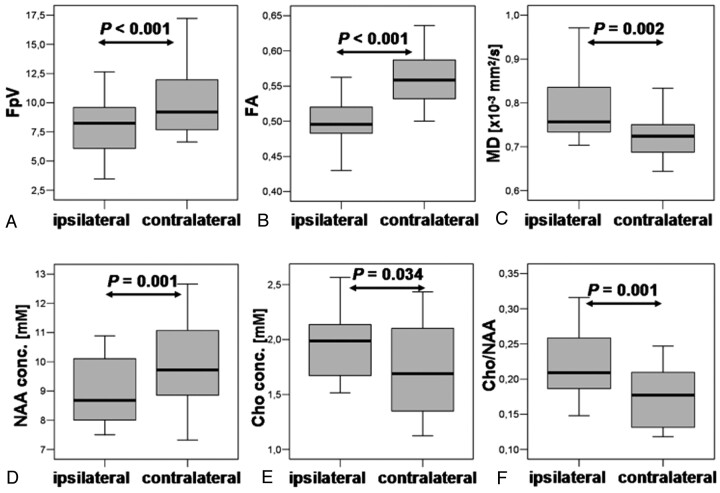
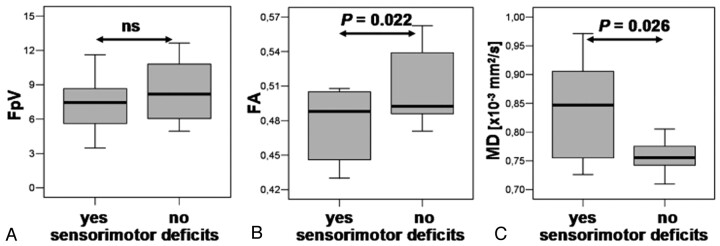
Results: For the whole pyramidal tract, quantitative DT fiber tracking resulted in significantly lower FpV and FA values (P < .001), but not MD values, for the ipsilateral hemisphere. For the section of the fiber bundle closest to the lesion, we found significantly decreased FpV and FA (P < .001) and increased MD (P = .002). MRSI showed, for the same volumes of interest, significantly decreased NAA (P = .001), increased Cho (P = .034) and Cho/NAA (P = .001) for the ipsilateral pyramidal tract. In patients suffering sensorimotor deficits, we found significantly lower FA (P = .022) and higher MD values (P = .026) and a strongly negative correlation between FA and MD (R = -0.710, P = .024) but no correlation in patients without deficits (R = 0.078, ns).
Conclusion: Quantitative DTI was able to show significant differences in diffusivity of the pyramidal tract in patients with sensorimotor deficits in relation to patients without them. The additional use of proton MRSI may be helpful to discern whether these diffusivity changes in fiber tracts are caused by tumor infiltration or peritumoral edema.
Figures
Similar articles
-
Disarrangement of fiber tracts and decline of neuronal density correlate in glioma patients--a combined diffusion tensor imaging and 1H-MR spectroscopy study.AJNR Am J Neuroradiol. 2006 Aug;27(7):1426-31. AJNR Am J Neuroradiol. 2006. PMID: 16908551 Free PMC article.
-
Measurements of diagnostic examination performance using quantitative apparent diffusion coefficient and proton MR spectroscopic imaging in the preoperative evaluation of tumor grade in cerebral gliomas.Eur J Radiol. 2011 Nov;80(2):462-70. doi: 10.1016/j.ejrad.2010.07.017. Epub 2010 Aug 13. Eur J Radiol. 2011. PMID: 20708868
-
Detection of tumour invasion into the pyramidal tract in glioma patients with sensorimotor deficits by correlation of (18)F-fluoroethyl-L: -tyrosine PET and magnetic resonance diffusion tensor imaging.Acta Neurochir (Wien). 2009 Sep;151(9):1061-9. doi: 10.1007/s00701-009-0378-2. Epub 2009 May 26. Acta Neurochir (Wien). 2009. PMID: 19468675
-
Improved delineation of brain tumors: an automated method for segmentation based on pathologic changes of 1H-MRSI metabolites in gliomas.Neuroimage. 2004 Oct;23(2):454-61. doi: 10.1016/j.neuroimage.2004.06.022. Neuroimage. 2004. PMID: 15488395
-
Prediction of Neurological Impairment in Cervical Spondylotic Myelopathy using a Combination of Diffusion MRI and Proton MR Spectroscopy.PLoS One. 2015 Oct 2;10(10):e0139451. doi: 10.1371/journal.pone.0139451. eCollection 2015. PLoS One. 2015. PMID: 26431174 Free PMC article. Clinical Trial.
Cited by
-
Optimal Factors of Diffusion Tensor Imaging Predicting Corticospinal Tract Injury in Patients with Brain Tumors.Korean J Radiol. 2017 Sep-Oct;18(5):844-851. doi: 10.3348/kjr.2017.18.5.844. Epub 2017 Jul 17. Korean J Radiol. 2017. PMID: 28860902 Free PMC article.
-
A pilot study of pre-operative motor dysfunction from gliomas in the region of corticospinal tract: Evaluation with diffusion tensor imaging.PLoS One. 2017 Aug 22;12(8):e0182795. doi: 10.1371/journal.pone.0182795. eCollection 2017. PLoS One. 2017. PMID: 28829841 Free PMC article.
-
Imaging biomarkers of brain tumour margin and tumour invasion.Br J Radiol. 2011 Dec;84 Spec No 2(Spec Iss 2):S159-67. doi: 10.1259/bjr/26838774. Br J Radiol. 2011. PMID: 22433826 Free PMC article. Review.
-
Quantitative assessment of changes in diffusion tensor imaging (DTI) metrics along the courses of the cortico-ponto-cerebellar tracts secondary to supratentorial human brain glial tumors.Cancer Rep (Hoboken). 2018 Aug;1(2):e1108. doi: 10.1002/cnr2.1108. Epub 2018 Jul 11. Cancer Rep (Hoboken). 2018. PMID: 32721087 Free PMC article.
-
Fiber density index, fractional anisotropy, adc and clinical motor findings in the white matter of patients with glioblastoma.Eur Radiol. 2008 Feb;18(2):331-6. doi: 10.1007/s00330-007-0740-9. Epub 2007 Sep 25. Eur Radiol. 2008. PMID: 17899109
References
-
- Mori S, Crain BJ, Chacko VP, et al. Three-dimensional tracking of axonal projections in the brain by magnetic resonance imaging. Ann Neurol 1999;45:265–69 - PubMed
-
- Jones DK, Simmons A, Williams SC, et al. Non-invasive assessment of axonal fiber connectivity in the human brain via diffusion tensor MRI. Magn Reson Med 1999;42:37–41 - PubMed
-
- Le Bihan D, Mangin JF, Poupon C, et al. Diffusion tensor imaging: concepts and applications. J Magn Reson Imaging 2001;13:534–46 - PubMed
-
- Mori S, Kaufmann WE, Davatzikos C, et al. Imaging cortical association tracts in the human brain using diffusion-tensor-based axonal tracking. Magn Reson Med 2002;47:215–23 - PubMed
-
- Nimsky C, Ganslandt O, Hastreiter P, et al. Intraoperative diffusion-tensor MR imaging: shifting of white matter tracts during neurosurgical procedures–initial experience. Radiology 2005;234:218–25 - PubMed
Publication types
MeSH terms
Substances
LinkOut - more resources
Full Text Sources
Medical
Miscellaneous