. 2007 Mar 27;115(12):1551-62.
doi: 10.1161/CIRCULATIONAHA.106.658641. Epub 2007 Mar 12.

Amplified expression profiling of platelet transcriptome reveals changes in arginine metabolic pathways in patients with sickle cell disease

Affiliations

Amplified expression profiling of platelet transcriptome reveals changes in arginine metabolic pathways in patients with sickle cell disease

Nalini Raghavachari et al. Circulation. .

Abstract

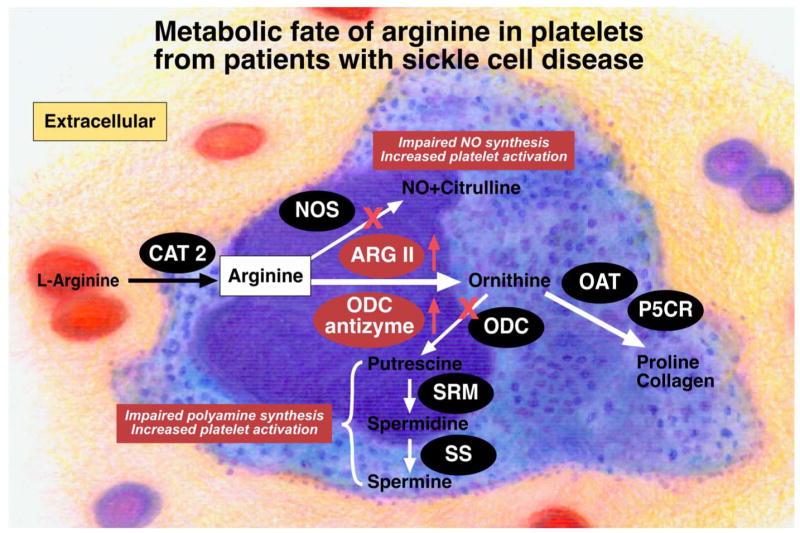
Background: In sickle cell disease, ischemia-reperfusion injury and intravascular hemolysis produce endothelial dysfunction and vasculopathy characterized by reduced nitric oxide and arginine bioavailability. Recent functional studies of platelets in patients with sickle cell disease reveal a basally activated state, which suggests that pathological platelet activation may contribute to sickle cell disease vasculopathy.

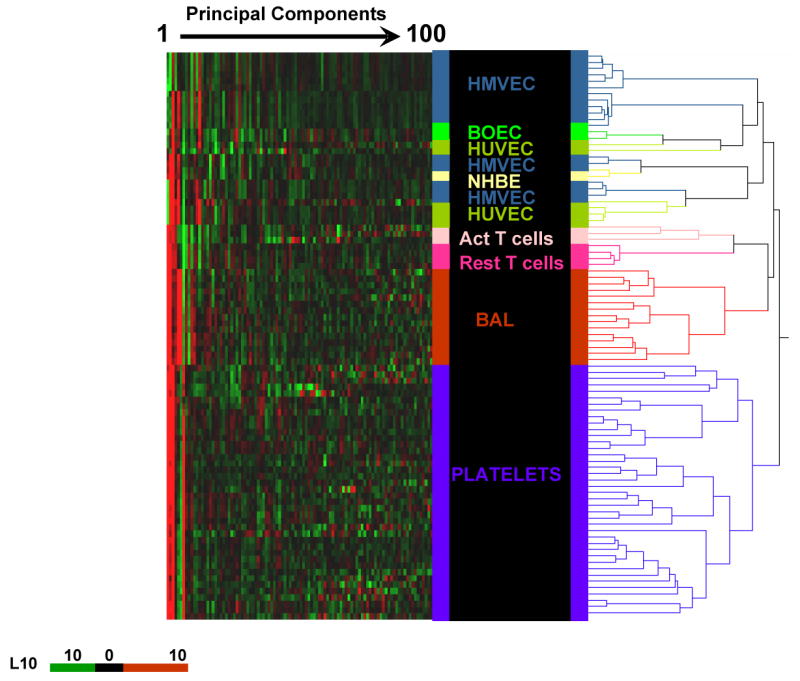
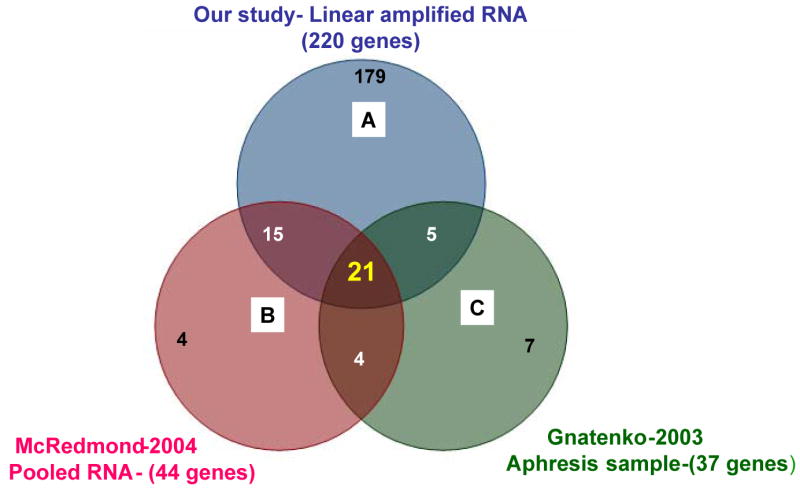
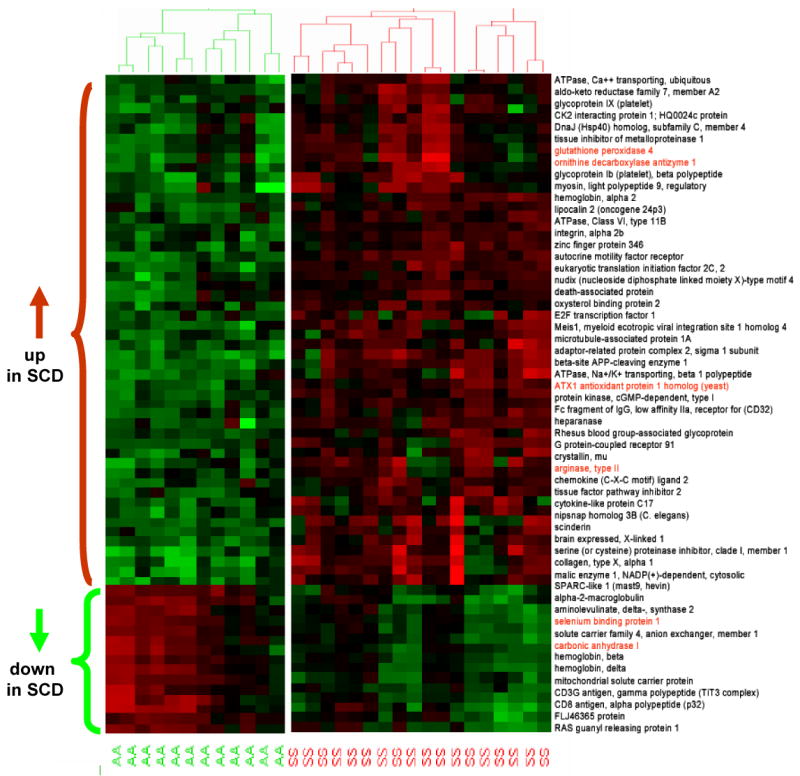
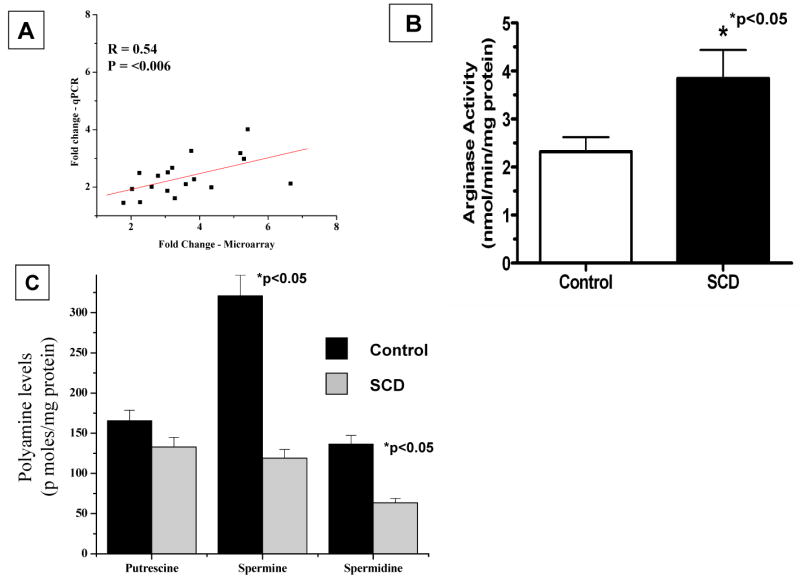
Methods and results: Studies were therefore undertaken to examine transcriptional signaling pathways in platelets that may be dysregulated in sickle cell disease. We demonstrate and validate in the present study the feasibility of comparative platelet transcriptome studies on clinical samples from single donors by the application of RNA amplification followed by microarray-based analysis of 54,000 probe sets. Data mining an existing microarray database, we identified 220 highly abundant genes in platelets and a subset of 72 relatively platelet-specific genes, defined by >10-fold increased expression compared with the median of other cell types in the database with amplified transcripts. The highly abundant platelet transcripts found in the present study included 82% or 70% of platelet-abundant genes identified in 2 previous gene expression studies on nonamplified mRNA from pooled or apheresis samples, respectively. On comparing the platelet gene expression profiles in 18 patients with sickle cell disease in steady state to those of 12 black control subjects, at a 3-fold cutoff and 5% false-discovery rate, we identified approximately 100 differentially expressed genes, including multiple genes involved in arginine metabolism and redox homeostasis. Further characterization of these pathways with real-time polymerase chain reaction and biochemical assays revealed increased arginase II expression and activity and decreased platelet polyamine levels.

Conclusions: The present studies suggest a potential pathogenic role for platelet arginase and altered arginine and polyamine metabolism in sickle cell disease and provide a novel framework for the study of disease-specific platelet biology.


Figures

Figure 1
Figure 1
Principal component heat map analysis of the first 100 principal components representing 83% variability of 98 samples of different human cell types. Hierarchical cluster analysis was performed on transcriptome data derived from all samples in our database that were processed similarly by the 2-round amplification process and hybridized to HG-U133A or HG-U133 Plus 2.0 gene chips. Each principal component value for each sample is represented with a red, black, and green color scale. The dendrogram displays the clustering of samples according to their expression pattern and segregation of cell types of the same phenotype, thus revealing a distinct expression pattern for each of the cell types studied. HMVEC indicates human microvascular endothelial cells; BOEC, blood outgrowth endothelial cells; HUVEC, human umbilical vein endothelial cells; NHBE, normal human bronchial epithelial cells; PBMC, peripheral blood mononuclear cells; Act T, activated T lymphocytes; Rest T, resting T lymphocytes; and BAL, bronchoalveolar lavage cells.
Figure 2
Figure 2
Venn diagram comparing 3 lists of genes. Comparison of (A) 220 platelet-abundant genes identified with amplified RNA from single donors, (B) 44 platelet-abundant genes identified with pooled RNA from several donors, and (C) 37 platelet-abundant genes identified with RNA from apheresis samples. In total, there were 21 genes that overlapped by all 3 methods. Nineteen percent of our gene list of 220 genes was reported in either or both of the previous studies cited.
Figure 3
Figure 3
Heat map of differential gene expression in platelets in sickle cell disease (SCD) compared with control subjects. Cluster analysis was applied to gene expression data derived from all probes on HG-U133 Plus 2.0 at a false-discovery rate of 5% and fold change (FC) >3.0 from 18 SCD patients (SS) and 12 control subjects (AA). The level of expression of each gene in each sample relative to the mean level of expression of that gene across all samples is represented with a red, black, and green color scale (green indicates below mean; black, equal to mean; and red, above mean). The dendrogram displays the unsupervised clustering of patients and control subjects using the differentially expressed gene list. Gene names are displayed on the right side of the figure, and genes of interest are highlighted.
Figure 4
Figure 4
Modulation of arginase II mRNA abundance, arginase activity, and polyamine levels in platelets of patients with sickle cell disease (SCD). A, Correlation of fold change of arginase II mRNA abundance in SCD patients determined by microarray platform and TaqMan gene expression assay–based real-time polymerase chain reaction (PCR). X-axis represents log2-fold change determined by microarrays; y-axis represents log2-fold change determined by real-time PCR (qPCR). B, Platelet total arginase activity in SCD patients and control subjects. Arginase activity was determined as described in Methods. Values are expressed as mean±SD for 10 controls and 10 SCD patients. *P for comparison of SCD patients vs control subjects. C, Concentrations of polyamines in platelets from patients with SCD and control subjects. Polyamines were quantitated by high-performance liquid chromatography as described in Methods and are expressed as picomoles per milligram of protein (shown as mean±SD for 10 controls and 10 SCD patients). *P for comparison of SCD patients vs control subjects.
Figure 5
Figure 5
Schematic illustration of the metabolic fate of arginine in platelets in sickle cell disease. Under normal situations, arginine will be taken up by the platelets via cationic amino acid transporter-2 (CAT-2) for the synthesis of NO and polyamines, which protect cells from activation and aggregation. In sickle cell disease, increased arginase activity and consequent limitation in arginine bioavailability is expected to impair NO synthesis, whereas reduced polyamine levels will enhance platelet aggregation. The increased production of ornithine via arginase II (ARG-2), instead of going toward polyamine synthesis, would be diverted toward proline synthesis, consistent with increased levels of mRNA encoding pyrroline-5-carboxylate reductase (P5CR). Increased expression of enzymes is indicated by the red upward-pointing arrows and red highlighting of enzymes. ODC indicates ornithine decarboxylase; SRM, spermidine synthase; SS, spermine synthase; and antizyme, ornithine decarboxylase antizyme.

References

    1. Bunn HF. Pathogenesis and treatment of sickle cell disease. N Engl J Med. 1997;337:762–769. - PubMed
    1. Morris CR, Kato GJ, Poljakovic M, Wang X, Blackwelder WC, Sachdev V, Hazen SL, Vichinsky EP, Morris SM, Jr, Gladwin MT. Dysregulated arginine metabolism, hemolysis-associated pulmonary hypertension, and mortality in sickle cell disease. JAMA. 2005;294:81–90. - PMC - PubMed
    1. Reiter CD, Gladwin MT. An emerging role for nitric oxide in sickle cell disease vascular homeostasis and therapy. Curr Opin Hematol. 2003;10:99–107. - PubMed
    1. Castro O, Hoque M, Brown BD. Pulmonary hypertension in sickle cell disease: cardiac catheterization results and survival. Blood. 2003;101:1257–1261. - PubMed
    1. Gladwin MT, Sachdev V, Jison ML, Shizukuda Y, Plehn JF, Minter K, Brown B, Coles WA, Nichols JS, Ernst I, Hunter LA, Blackwelder WC, Schechter AN, Rodgers GP, Castro O, Ognibene FP. Pulmonary hypertension as a risk factor for death in patients with sickle cell disease. N Engl J Med. 2004;350:886–895. - PubMed

Publication types