

Targeting homeostatic mechanisms of endoplasmic reticulum stress to increase susceptibility of cancer cells to fenretinide-induced apoptosis: the role of stress proteins ERdj5 and ERp57
- PMID: 17353921
- PMCID: PMC2360126
- DOI: 10.1038/sj.bjc.6603672
Targeting homeostatic mechanisms of endoplasmic reticulum stress to increase susceptibility of cancer cells to fenretinide-induced apoptosis: the role of stress proteins ERdj5 and ERp57
Abstract
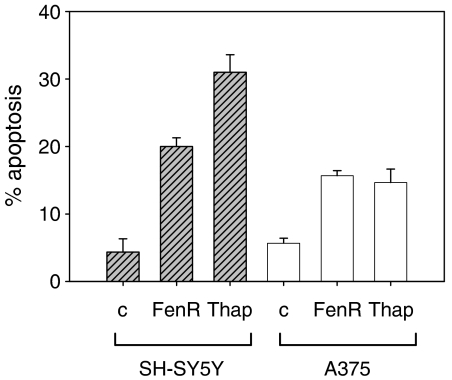
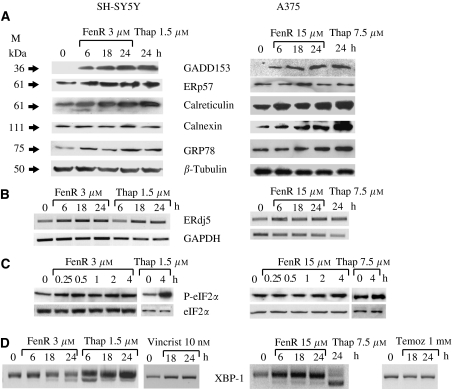
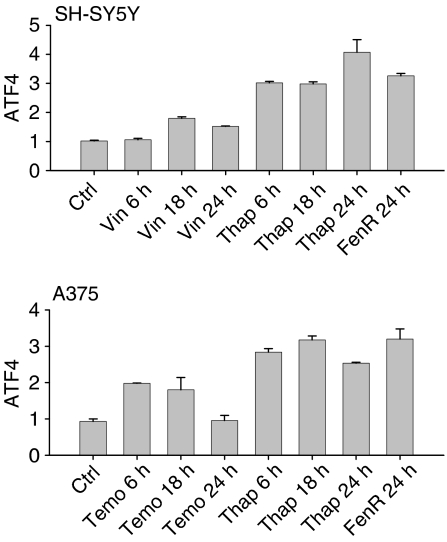
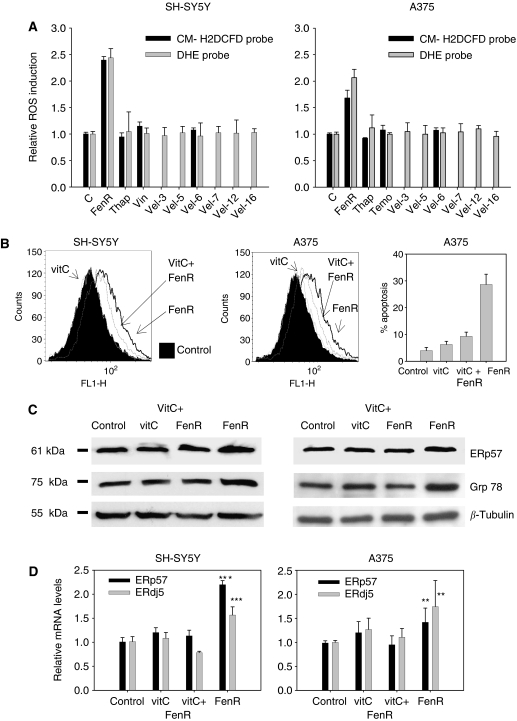
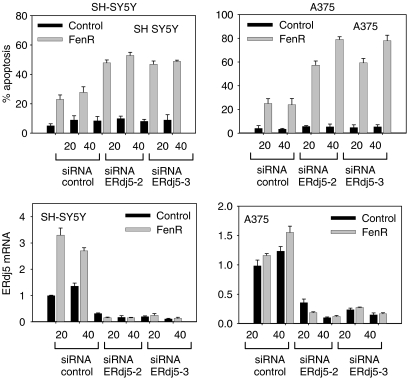
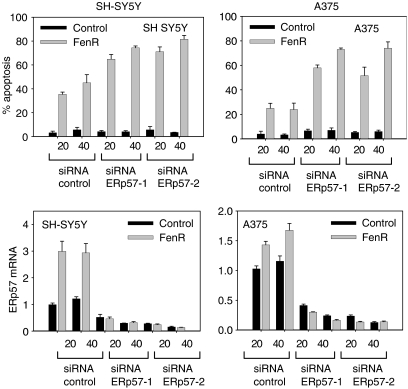
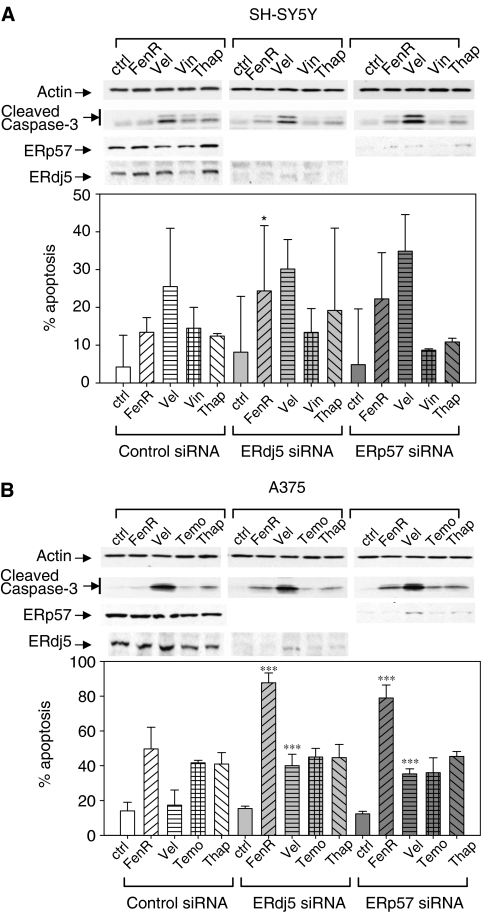
Endoplasmic reticulum (ER) malfunction, leading to ER stress, can be a consequence of genome instability and hypoxic tissue environments. Cancer cells survive by acquiring or enhancing survival mechanisms to counter the effects of ER stress and these homeostatic responses may be new therapeutic targets. Understanding the links between ER stress and apoptosis may be approached using drugs specifically to target ER stress responses in cancer cells. The retinoid analogue fenretinide [N-(4-hydroxyphenyl) retinamide] is a new cancer preventive and chemotherapeutic drug, that induces apoptosis of some cancer cell types via oxidative stress, accompanied by induction of an ER stress-related transcription factor, GADD153. The aim of this study was to test the hypothesis that fenretinide induces ER stress in neuroectodermal tumour cells, and to elucidate the role of ER stress responses in fenretinide-induced apoptosis. The ER stress genes ERdj5, ERp57, GRP78, calreticulin and calnexin were induced in neuroectodermal tumour cells by fenretinide. In contrast to the apoptosis-inducing chemotherapeutic drugs vincristine and temozolomide, fenretinide induced the phosphorylation of eIF2alpha, expression of ATF4 and splicing of XBP-1 mRNA, events that define ER stress. In these respects, fenretinide displayed properties similar to the ER stress inducer thapsigargin. ER stress responses were inhibited by antioxidant treatment. Knockdown of ERp57 or ERdj5 by RNA interference in these cells increased the apoptotic response to fenretinide. These data suggest that downregulating homeostatic ER stress responses may enhance apoptosis induced by oxidative stress-inducing drugs acting through the ER stress pathway. Therefore, ER-resident proteins such as ERdj5 and ERp57 may represent novel chemotherapeutic targets.
Figures
Similar articles
-
Induction of endoplasmic reticulum stress by the pro-apoptotic retinoid N-(4-hydroxyphenyl)retinamide via a reactive oxygen species-dependent mechanism in human head and neck cancer cells.Cancer Biol Ther. 2007 May;6(5):705-11. doi: 10.4161/cbt.6.5.3963. Epub 2007 Feb 3. Cancer Biol Ther. 2007. PMID: 17404501
-
Regulation of endoplasmic reticulum stress-induced cell death by ATF4 in neuroectodermal tumor cells.J Biol Chem. 2010 Feb 26;285(9):6091-100. doi: 10.1074/jbc.M109.014092. Epub 2009 Dec 18. J Biol Chem. 2010. PMID: 20022965 Free PMC article.
-
ERdj5 sensitizes neuroblastoma cells to endoplasmic reticulum stress-induced apoptosis.J Biol Chem. 2009 Mar 6;284(10):6282-90. doi: 10.1074/jbc.M806189200. Epub 2009 Jan 4. J Biol Chem. 2009. PMID: 19122239
-
Molecular mechanisms of fenretinide-induced apoptosis of neuroblastoma cells.Ann N Y Acad Sci. 2004 Dec;1028:81-9. doi: 10.1196/annals.1322.009. Ann N Y Acad Sci. 2004. PMID: 15650234 Review.
-
Induction of GADD153 and Bak: novel molecular targets of fenretinide-induced apoptosis of neuroblastoma.Cancer Lett. 2003 Jul 18;197(1-2):157-63. doi: 10.1016/s0304-3835(03)00098-3. Cancer Lett. 2003. PMID: 12880976 Review.
Cited by
-
ER stress inducer tunicamycin suppresses the self-renewal of glioma-initiating cell partly through inhibiting Sox2 translation.Oncotarget. 2016 Jun 14;7(24):36395-36406. doi: 10.18632/oncotarget.8954. Oncotarget. 2016. PMID: 27119230 Free PMC article.
-
Anti-Cancer Natural Products and Their Bioactive Compounds Inducing ER Stress-Mediated Apoptosis: A Review.Nutrients. 2018 Aug 4;10(8):1021. doi: 10.3390/nu10081021. Nutrients. 2018. PMID: 30081573 Free PMC article. Review.
-
Combining the endoplasmic reticulum stress-inducing agents bortezomib and fenretinide as a novel therapeutic strategy for metastatic melanoma.Clin Cancer Res. 2009 Feb 15;15(4):1192-8. doi: 10.1158/1078-0432.CCR-08-2150. Clin Cancer Res. 2009. PMID: 19228725 Free PMC article.
-
Preclinical evaluation of fenretinide against primary and metastatic intestinal type‑gastric cancer.Oncol Lett. 2024 Sep 25;28(6):561. doi: 10.3892/ol.2024.14694. eCollection 2024 Dec. Oncol Lett. 2024. PMID: 39372665 Free PMC article.
-
Differential expression of apoptotic genes PDIA3 and MAP3K5 distinguishes between low- and high-risk prostate cancer.Mol Cancer. 2009 Dec 27;8:130. doi: 10.1186/1476-4598-8-130. Mol Cancer. 2009. PMID: 20035634 Free PMC article.
References
-
- Albino AP, Juan G, Traganos F, Reinhart L, Connolly J, Rose DP, Darzynkiewicz Z (2000) Cell cycle arrest and apoptosis of melanoma cells by docosahexaenoic acid: association with decreased pRb phosphorylation. Cancer Res 60: 4139–4145 - PubMed
-
- Bedard K, Szabo E, Michalak M, Opas M (2005) Cellular functions of endoplasmic reticulum chaperones calreticulin, calnexin, and ERp57. Int Rev Cytol 245: 91–121 - PubMed
-
- Bertolotti A, Zhang Y, Hendershot LM, Harding HP, Ron D (2000) Dynamic interaction of BiP and ER stress transducers in the unfolded-protein response. Nat Cell Biol 2: 326–332 - PubMed
-
- Brostrom CO, Brostrom MA (1998) Regulation of translational initiation during cellular responses to stress. Prog Nucleic Acid Res Mol Biol 58: 79–125 - PubMed
-
- Calfon M, Harding HP (2004) Marcie Calfon's & Heather Harding's protocol for detection of XBP-1 processing in mouse or human cells. http://saturn.med.nyu.edu/research/mp/ronlab/protocols/XBP-1.splicing.04...
Publication types
MeSH terms
Substances
LinkOut - more resources
Full Text Sources
Other Literature Sources
Research Materials
Miscellaneous
