. 2007:3:91.
doi: 10.1038/msb4100135. Epub 2007 Mar 13.

Gyrase inhibitors induce an oxidative damage cellular death pathway in Escherichia coli

Affiliations

Gyrase inhibitors induce an oxidative damage cellular death pathway in Escherichia coli

Daniel J Dwyer et al. Mol Syst Biol. 2007.

Abstract

Modulation of bacterial chromosomal supercoiling is a function of DNA gyrase-catalyzed strand breakage and rejoining. This reaction is exploited by both antibiotic and proteic gyrase inhibitors, which trap the gyrase molecule at the DNA cleavage stage. Owing to this interaction, double-stranded DNA breaks are introduced and replication machinery is arrested at blocked replication forks. This immediately results in bacteriostasis and ultimately induces cell death. Here we demonstrate, through a series of phenotypic and gene expression analyses, that superoxide and hydroxyl radical oxidative species are generated following gyrase poisoning and play an important role in cell killing by gyrase inhibitors. We show that superoxide-mediated oxidation of iron-sulfur clusters promotes a breakdown of iron regulatory dynamics; in turn, iron misregulation drives the generation of highly destructive hydroxyl radicals via the Fenton reaction. Importantly, our data reveal that blockage of hydroxyl radical formation increases the survival of gyrase-poisoned cells. Together, this series of biochemical reactions appears to compose a maladaptive response, that serves to amplify the primary effect of gyrase inhibition by oxidatively damaging DNA, proteins and lipids.


Figures
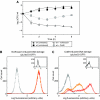
Figure 1
Figure 1
Phenotypic response to gyrase inhibition. (A) Log change in colony forming units per ml (CFU/ml) of wild-type, BW25113 E. coli cells (mean±s.d.). Untreated (black triangles, solid line) and uninduced (harboring CcdB plasmid; black squares, dashed line) cell growth, respectively, was compared with the growth of norfloxacin-treated (250 ng/ml; gray triangles, solid line) and CcdB-expressing (gray squares, dashed line) cultures. (B, C) Induction of DNA damage by gyrase inhibitors. To confirm the occurrence of DNA damage following gyrase poisoning, we employed an engineered promoter-GFP reporter gene construct, pL(lexO)-GFP. LexA cleavage, and thus DNA lesion formation, could be examined at single-cell resolution by measuring green fluorescent protein expression using a flow cytometer. Shown are representative fluorescence population distributions of wild-type cultures (B) treated with norfloxacin, or (C) expressing CcdB, before (time zero, gray) and after (3 h (orange) and 6 h (red)) gyrase inhibition. The respective insets show representative control fluorescence measurements of uninhibited wild-type cultures at time zero (gray) and 6 h (black).
Figure 2
Figure 2
Transcriptome response to gyrase inhibition. Highlighted is a portion of the functionally enriched gene expression response of norfloxacin-treated or CcdB-expressing wild-type cells. Relative weighted z-scores (a measure of standard deviation) were calculated for each gene, based on comparison to mean expression values derived from a large (∼500) database of microarray data; these values were then normalized by subtracting the corresponding uninduced sample z-scores. Using biochemical pathway and transcription factor regulatory classifications, we identified significantly upregulated functional units that responded in a coordinated manner. For each functional unit, genes that exhibited a weighted z-score ⩾2 standard deviations are shown; scale is shown on left. This analysis is described in greater detail in Materials and methods and Supplementary information. Additionally, all gyrase inhibitor microarray results can be found in Supplementary information.
Figure 3
Figure 3
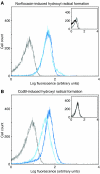
Generation of hydroxyl radicals following gyrase inhibition. Formation of oxidatively damaging hydroxyl radicals was measured using the highly specific fluorescent dye, HPF. Hydroxyl radical generation was observed following both (A) norfloxacin treatment and (B) CcdB expression. Representative flow cytometer-measured fluorescence population distributions of wild-type cells before (time zero, gray) and after (3 h (light blue) and 6 h (blue)) gyrase inhibition are shown. The respective insets show representative control fluorescence population distributions of uninhibited wild-type cultures at time zero (gray) and 6 h (black).
Figure 4
Figure 4
Iron chelation prevents hydroxyl radical formation and reduces gyrase inhibitor-mediated cell death. Application of the iron chelator, o-phenanthroline, suppresses the formation of hydroxyl radicals and reduces cell death following gyrase inhibition in wild-type E. coli cells. (A, B) Using the fluorescent reporter dye, HPF, we monitored the effect of o-phenanthroline addition on hydroxyl radical formation in (A) norfloxacin-treated and (B) CcdB-expressing wild-type cells. Representative flow cytometer-measured fluorescence population distributions of wild-type cells before (time zero, gray) and after (6 h (green)) gyrase inhibition, in the presence of the iron chelator are shown. For direct comparison, fluorescent population distributions of gyrase-inhibited cells, at 6 h, in the absence of chelator, are also shown (blue). (C) Log change in colony forming units per ml (CFU/ml) of wild-type cells (mean±s.d.). Cells were grown in the presence of o-phenanthroline and treated with norfloxacin (250 ng/ml, green triangles, solid line) or induced to express CcdB (green squares, dashed line). These results were compared with the growth of cells treated with norfloxacin (gray triangles, solid line) or expressing CcdB (gray squares, dashed line) alone. As controls, normal growth (black triangles, solid line) and growth in the presence of o-phenanthroline alone (purple triangles, solid line) are shown.
Figure 5
Figure 5
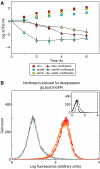
Gyrase inhibition induces iron misregulation. (A) Log change in colony forming units per ml (CFU/ml) of BW25113 E. coli single-gene deletion strains. Growth curves for untreated deletion strains are shown for comparison purposes and are representative of growth in the absence of perturbation. Survival data for treated samples are represented as mean±s.d. Survival of Δfur cultures (untreated, red circles, dotted line; norfloxacin-treated, red triangles, solid line), ΔtonB cultures (untreated, light blue circles, dotted line; norfloxacin-treated, light blue triangles, solid line) and ΔiscS cultures (untreated, yellow circles, dotted line; norfloxacin-treated, yellow triangles, solid line) are shown. (B) Misregulation of iron-related genes following gyrase inhibition. To confirm that derepression, by Fur, of iron uptake and utilization genes ocurs upon inhibition of gyrase, we employed an engineered promoter-GFP reporter gene construct, pL(furO)-GFP, and performed flow cytometer-based measurements at single-cell resolution. Representative fluorescence population distributions of norfloxacin-treated wild-type cultures before (time zero, gray) and after (3 h (orange) and 6 h (red)) gyrase inhibition are shown. The respective insets show representative control fluorescence measurements of uninhibited wild-type cultures at time zero (gray) and 6 h (black).
Figure 6
Figure 6
Gyrase inhibition induces the superoxide response and upregulation of iron–sulfur cluster assembly. (A) Induction of the superoxide response following gyrase inhibition. To confirm that the superoxide response was activated upon inhibition of gyrase, we employed the native soxS promoter in a promoter-GFP reporter gene construct, pSoxS-GFP; transcription from the soxS promoter is activated upon superoxide-based oxidation to the iron–sulfur cluster of the SoxR transcription factor. (B) Upregulation of Fe–S cluster assembly-related gene expression following gyrase inhibition. To determine whether expression of the Isc family of Fe–S cluster synthesis was increased upon inhibition of gyrase, we employed the native iscRUSA promoter in a promoter-GFP reporter gene construct, pIscRUSA-GFP; the iscRUSA promoter is autoregulated by IscR and is activated, for example, when Fe–S clusters are oxidized. Measurements of both constructs were taken, at single-cell resolution, using a flow cytometer. Representative fluorescence population distributions of norfloxacin-treated wild-type cultures before (time zero, gray) and after (3 h (orange) and 6 h (red)) gyrase inhibition are shown. The respective insets show representative control fluorescence measurements of uninhibited wild-type cultures at time zero (gray) and 6 h (black). (C) Log change in colony forming units per ml (CFU/ml) of BW25113 E. coli single-gene deletion strains. Growth curves for untreated deletion strains are shown for comparison purposes and are representative of growth in the absence of norfloxacin treatment. Survival data for treated samples are represented as mean±s.d. Survival of ΔatpC (untreated, purple circles, dotted line; norfloxacin-treated, purple triangles, solid line), ΔsdhB (untreated, light green circles, dotted line; norfloxacin-treated, light green triangles, solid line) and ΔsodB cultures (untreated, brown circles, dotted line; norfloxacin treated, brown triangles, solid line) are shown.
Figure 7
Figure 7
Generation of hydroxyl radicals in ΔatpC, ΔiscS and ΔsodB cells upon gyrase inhibition. Formation of oxidatively damaging hydroxyl radicals was measured using the highly specific fluorescent dye, HPF. Shown are representative flow cytometer-measured fluorescence population distributions of ΔatpC (purple), ΔiscS (yellow) and ΔsodB (brown) cultures taken 6 h after treatment with norfloxacin. For comparison, fluorescence measurements of wild-type cells before (time zero, gray) and after (6 h (blue)) gyrase inhibition are also shown.
Figure 8
Figure 8
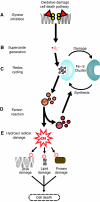
Oxidative damage cell death pathway model. A model for iron misregulation and reactive oxygen species generation following gyrase inhibition and DNA damage formation. (A) Gyrase inhibitors (red triangles), such as norfloxacin and CcdB, target DNA-bound gyrase (yellow circles). The resultant complex induces double-stranded breakage and loss of chromosomal supercoiling by preventing strand rejoining by the gyrase enzyme. (B) Gyrase poisoning promotes the generation of superoxide (O2), which (C) oxidatively attacks iron–sulfur clusters (three-dimensional cube depicts [4Fe–4S] cluster; iron and sulfur are shown as orange and blue circles, respectively); sustained superoxide attack of iron–sulfur-containing proteins (light blue) leads to functional inactivation (dark blue), destabilization and iron leaching. (D) Repetitious oxidation and repair of clusters, or redox cycling, promotes iron misregulation and may serve to generate a cytoplasmic pool of 'free' ferrous (Fe2+) iron. (E) Ferrous iron, via the Fenton reaction, rapidly catalyzes the formation of deleterious hydroxyl radicals (OH), which readily damage DNA, lipids and proteins; the Fenton reaction can thus take place at destabilized iron–sulfur clusters or where ‘free' ferrous iron has accumulated. We propose that reactive oxygen species are generated via an oxygen-dependent death pathway that amplifies the primary effect of gyrase inhibition and contributes to cell death following gyrase poisoning.

Comment in

  • The complexities of antibiotic action.
    Hancock RE. Hancock RE. Mol Syst Biol. 2007;3:142. doi: 10.1038/msb4100184. Epub 2007 Oct 16. Mol Syst Biol. 2007. PMID: 17940532 Free PMC article. No abstract available.

References

    1. Andrews SC, Robinson AK, Rodriguez-Quinones F (2003) Bacterial iron homeostasis. FEMS Microbiol Rev 27: 215–237 - PubMed
    1. Aruoma OI, Halliwell B, Dizdaroglu M (1989) Iron ion-dependent modification of bases in DNA by the superoxide radical-generating system hypoxanthine/xanthine oxidase. J Biol Chem 264: 13024–13028 - PubMed
    1. Asad NR, Leitao AC (1991) Effects of metal ion chelators on DNA strand breaks and inactivation produced by hydrogen peroxide in Escherichia coli: detection of iron-independent lesions. J Bacteriol 173: 2562–2568 - PMC - PubMed
    1. Ashburner M, Ball CA, Blake JA, Botstein D, Butler H, Cherry JM, Davis AP, Dolinski K, Dwight SS, Eppig JT, Harris MA, Hill DP, Issel-Tarver L, Kasarskis A, Lewis S, Matese JC, Richardson JE, Ringwald M, Rubin GM, Sherlock G (2000) Gene ontology: tool for the unification of biology. The Gene Ontology Consortium. Nat Genet 25: 25–29 - PMC - PubMed
    1. Baba T, Ara T, Hasegawa M, Takai Y, Okumura Y, Baba M, Datsenko KA, Tomita M, Wanner BL, Mori H (2006) Construction of Escherichia coli K-12 in-frame, single-gene knockout mutants: the Keio collection. Mol Syst Biol 2, 2006.0008 - PMC - PubMed

Publication types

MeSH terms