. 2007 Mar;5(3):e16.
doi: 10.1371/journal.pbio.0050016.

The Sorcerer II Global Ocean Sampling expedition: expanding the universe of protein families

Affiliations

The Sorcerer II Global Ocean Sampling expedition: expanding the universe of protein families

Shibu Yooseph et al. PLoS Biol. 2007 Mar.

Abstract

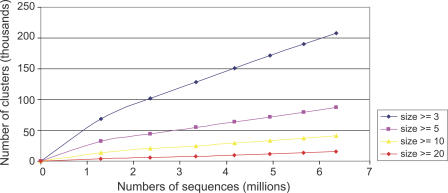
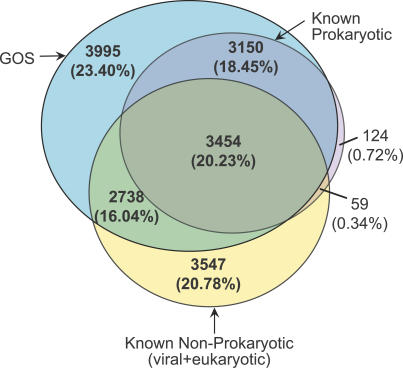
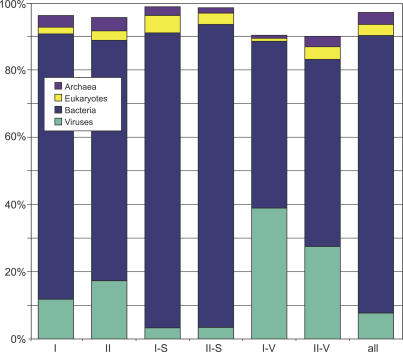
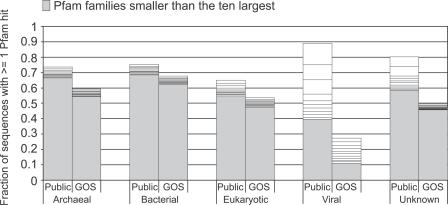
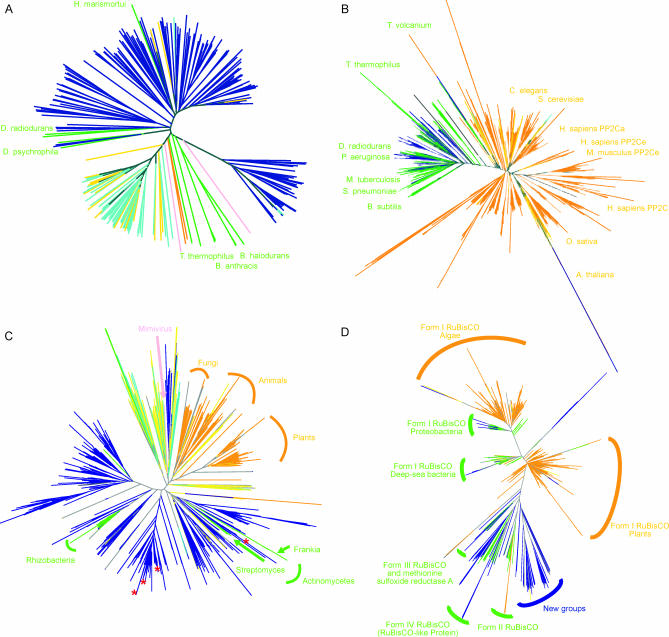
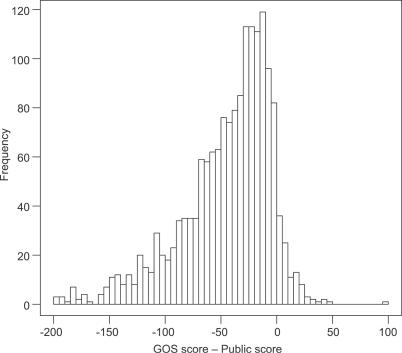
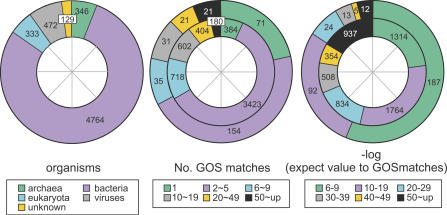
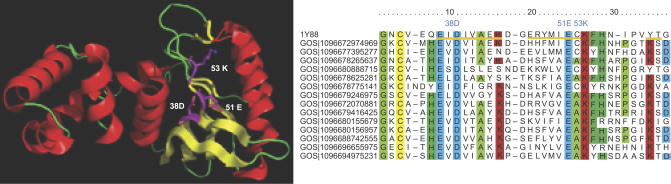
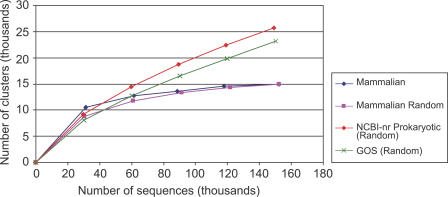
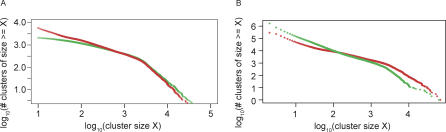
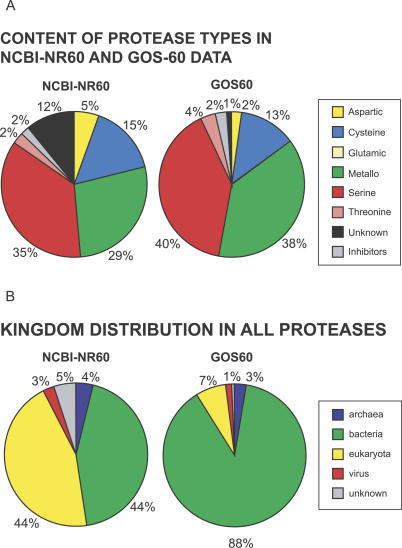
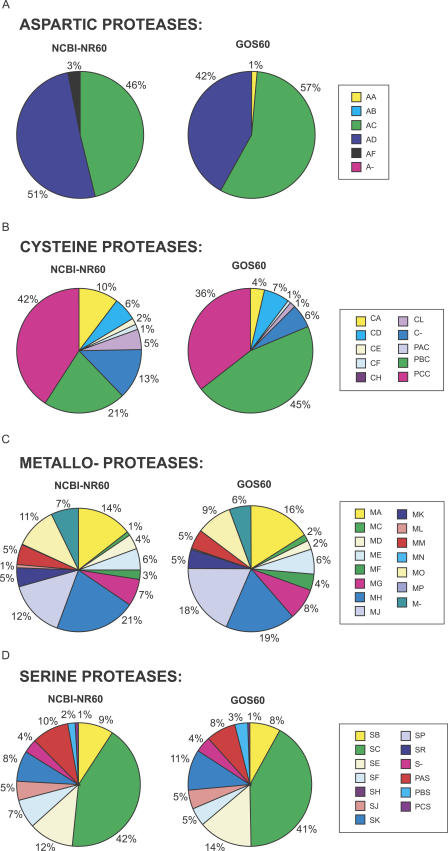
Metagenomics projects based on shotgun sequencing of populations of micro-organisms yield insight into protein families. We used sequence similarity clustering to explore proteins with a comprehensive dataset consisting of sequences from available databases together with 6.12 million proteins predicted from an assembly of 7.7 million Global Ocean Sampling (GOS) sequences. The GOS dataset covers nearly all known prokaryotic protein families. A total of 3,995 medium- and large-sized clusters consisting of only GOS sequences are identified, out of which 1,700 have no detectable homology to known families. The GOS-only clusters contain a higher than expected proportion of sequences of viral origin, thus reflecting a poor sampling of viral diversity until now. Protein domain distributions in the GOS dataset and current protein databases show distinct biases. Several protein domains that were previously categorized as kingdom specific are shown to have GOS examples in other kingdoms. About 6,000 sequences (ORFans) from the literature that heretofore lacked similarity to known proteins have matches in the GOS data. The GOS dataset is also used to improve remote homology detection. Overall, besides nearly doubling the number of current proteins, the predicted GOS proteins also add a great deal of diversity to known protein families and shed light on their evolution. These observations are illustrated using several protein families, including phosphatases, proteases, ultraviolet-irradiation DNA damage repair enzymes, glutamine synthetase, and RuBisCO. The diversity added by GOS data has implications for choosing targets for experimental structure characterization as part of structural genomics efforts. Our analysis indicates that new families are being discovered at a rate that is linear or almost linear with the addition of new sequences, implying that we are still far from discovering all protein families in nature.


Conflict of interest statement

Competing interests. The authors have declared that no competing interests exist.

Figures

Figure 1
Figure 1. Proportion of Sequences for Each Kingdom
(A) The combined set of NCBI-nr, PG, TGI-EST, and ENS has 3,167,979 sequences. The eukaryotes account for the largest portion and is more than twice the bacterial fraction. (B) Predicted kingdom proportion of sequences in GOS. Out of the 5,654,638 GOS sequences, 5,058,757 are assigned kingdoms using a BLAST-based scheme. The bacterial kingdom forms by far the largest fraction in the GOS set.
Figure 2
Figure 2. Rate of Discovery of Clusters as (Nonredundant) Sequences Are Added
The x-axis denotes the number of sequences (in millions) and the y-axis denotes the number of clusters (in thousands). Seven datasets with increasing numbers of (nonredundant) sequences are chosen as described in the text. The blue curve shows the number of core sets of size ≥3 for the seven datasets. Curves for core set sizes ≥5, ≥10, and ≥20 are also shown. Linear regression gives slopes 0.027 (R 2 = 0.999), 0.011 (R 2 = 0.999), 0.0053 (R 2 = 0.999), and 0.0024 (R 2 = 0.996) for size ≥3, size ≥5, size ≥10, and size ≥20, respectively.
Figure 3
Figure 3. Venn Diagram Showing Breakdown of the 17,067 Medium and Large Clusters by Three Categories—GOS, Known Prokaryotic, and Known Nonprokaryotic
Figure 4
Figure 4. Enrichment in the GOS-Only Set of Clusters for Viral Neighbors
Cluster sets from left to right are: I, GOS-only clusters with detectable BLAST, HMM, or profile-profile homology (Group I); II, GOS-only clusters with no detectable homology (Group II); I-S, a sample from all clusters chosen to have the same size distribution as Group I; II-S, a sample from all clusters chosen to have the same size distribution as Group II; I-V, a subset of clusters in Group I containing sequences collected from the viral size fraction; II-V, a subset of clusters in Group II from the viral size fraction; and all clusters. Notice that although predominantly bacterial, GOS-only clusters are assigned as viral based on their neighbors more often than the size-matched samples and the set of all clusters.
Figure 5
Figure 5. Coverage of GOS-100 and Public-100 by Pfam and Relative Sizes of Pfam Families by Kingdom, Sorted by Size
The public-100 sequences are annotated using the NCBI taxonomy and the source public database annotations. GOS-100 sequences were given kingdom weights as described in Materials and Methods. For each kingdom, the fraction of sequences with ≥1 Pfam match are shown, while the ten largest Pfam families shown as discrete sections whose size is proportional to the number of matches between that family and GOS-100 or public-100 sequences. Pfam families that are smaller than the ten largest are binned together in each column's bottom section. Pfam covers public-100 better than GOS-100 in all kingdoms, with the greatest difference occurring in the viral kingdom, where 89.1% of public-100 viral sequences match a Pfam domain, while only 27.5% of GOS-100s have a sequence match.
Figure 6
Figure 6. Maximum Likelihood Phylogeny for the IDO Family
The phylogeny is based on an alignment of 93 sequences from GOS-100 and 51 sequences from public-100 and NCBI-nr from March 2006 that matched the IDO Pfam model and satisfied multiple alignment quality criteria. The IDO family is eukaryotic specific in public-100. The phylogeny shows a clade with all the GOS sequences, predicted to be bacterial (navy blue), eukaryotic (yellow), or unknown (gray), along with two sequences from the marine bacteria Erythrobacter litoralis and Nitrosococcus oceani (lime green) submitted to the sequence database after February 2005, and a public-only clade of only eukaryotic sequences (orange).
Figure 7
Figure 7. Phylogenies Illustrating the Diversity Added by GOS Data to Known Families That We Examined
Kingdom assignments of the sequences are indicated by color: yellow, GOS-eukaryotic; navy blue, GOS-bacterial/archaeal; aqua, GOS-viral; orange, NCBI-nr–eukaryotic; lime green, NCBI-nr–bacterial/archaeal; pink, NCBI-nr–viral; gray, unclassified. (A) Phylogeny of UVDE homologs. (B) Phylogeny of PP2C-like sequences. (C) Phylogeny of type II GS gene family. In addition to the large amount of diversity of bacterial type II GS in the GOS data, a large group of GOS viral sequences and eukaryotic GS co-occur at the top of the tree with the eukaryotic virus Acanthamoeba polyphaga mimivirus (shown in pink). The red stars indicate the locations of eight type II GS sequences found in the type I–type II GS gene pairs. They are located in different branches of the phylogenetic tree. The rest of the type II GS sequences were filtered out by the 98% identity cutoff. (D) Phylogeny of the homologs of RuBisCO large subunit. A large portion of the RuBisCO sequences from the GOS data forms new branches that are distinct from the previously known RuBisCO sequences in the NCBI-nr database.
Figure 8
Figure 8. Distribution of Average HMM Score Difference between GOS and Public (NCBI-nr, MG, TGI-EST, and ENS)
Only matches to the full length of an HMM are considered, and only HMMs that have at least 100 matches to each of GOS and public databases are considered. This results in 1,686 HMMs whose average scores to GOS and public databases are considered. The mean of the distribution is −50, showing that GOS sequences tend to score lower than sequences in public, thereby reflecting diversity compared to sequences in public.
Figure 9
Figure 9. Pie Chart of ORFans That Had GOS Matches
ORFans are grouped by organism (left), number of their GOS matches (middle), and the lowest E-value to their GOS matches in negative logarithm form (right). For both middle and right charts, inner and outer circles represent noneukaryotic and eukaryotic ORFans, respectively. From the middle chart it is seen that 626 (= 404 + 180 + 21 + 21) ORFans form significant protein families with ≥20 GOS matches.
Figure 10
Figure 10. Structure and GOS Homologs of Hypothetical Protein AF1548
Yellow bars represent β-strands. Highlighted are predicted catalytic residues: 38D, 51E, and 53K.
Figure 11
Figure 11. Rate of Cluster Discovery for Mammals Compared to That for Microbes
The x-axis denotes the number of sequences (in thousands), and the y-axis denotes the number of clusters (in thousands). Five mammalian genomes are considered for the “Mammalian” dataset, and the plot shows the number of clusters that are hit when each additional genome is added. For the “Mammalian Random” dataset, the order of the sequences from the “Mammalian” dataset is randomized. For the NCBI-nr prokaryotic and GOS datasets, random subsets of size similar to that of the mammalian set are considered.
Figure 12
Figure 12. Log–Log Plots of Cluster Size Distributions
The x-axis is logarithm of the cluster size X and the y-axis is the logarithm of the number of clusters of size at least X; logarithms are base 10. (A) Plot comparing the sizes of clusters produced by our clustering approach (red) to those of clusters produced by Pfams (green). The curves track each other quite well, with both of them having an inflection point around cluster size 2,500 (approximately 3.4 on the x-axis). Each sequence is assigned to the highest scoring Pfam that it matches. Two sequences that are assigned to the same Pfam can nevertheless be assigned to different clusters by the full-sequence–based clustering approach if they differ in the remaining portion. This is especially true for commonly occurring domains that are present in different multidomain proteins. Thus, there tends to be a larger number of big clusters in the Pfam approach as compared to the full-sequence–based approach. Hence, the green curve is above the red curve at the higher sizes. (B) Plot of the cluster size distributions for core sets (green) and for final clusters (red). Both curves have an inflection point around cluster size 2,500 (approximately 3.4 on the x-axis). Note that these plots give the cumulative distribution function (cdf), while the power law exponents reported in the text are for the number of clusters of size X (i.e., the probability density function [pdf]). The relationship between these exponents is βpdf = 1 + βcdf.
Figure 13
Figure 13. Log–Log plot of Slopes m(d) of Linear Regression Fit to the Rate of Growth in Figure 2 for Different Values of Cluster Size d
According to the equation derived in the text, m(d) = md1 −β for some constant m. The best linear fit to log [m(d)] gives a line with slope −0.91 (R 2 = 0.98) that is close to the predicted value 1 − β = −0.99.
Figure 14
Figure 14. Receiver Operating Characteristic Curve Used to Evaluate Various Methods of Scoring Pairs of Clusters for Functional Similarity
Pairs of clusters with ≥1 example of neighboring ORFs and assigned GO terms were divided into a set of functionally related (true positive) and functionally unrelated (true negative) cluster pairs based on the similarity of their GO terms. The scoring methods evaluated are described in the text.
Figure 15
Figure 15. Novel GOS-Only Clusters Are More Interconnected Than a Size-Matched Sample of Clusters
Red line, novel clusters; green line, size-matched sample; blue line (right axis), log2 ratio of fraction novel clusters recovered divided by fraction sample clusters recovered.
Figure 16
Figure 16. GOS-Only Clusters Are Enriched for Sequences of Viral Origin Independently of the Kingdom Assignment Method Employed
For each panel, clusters are as in Figure 4. For (A–C), a kingdom is assigned to each neighboring ORF within each cluster set; the percentage of all neighboring ORFs with a given kingdom assignment is plotted. For (D–F), a kingdom is assigned to each cluster if more than 50% of all that cluster's neighbors with a kingdom assignment share the same assignment; the percentage of clusters in each set with a given assignment is plotted. In (A) and (D), a kingdom is assigned to a neighboring ORF by a majority vote of the top four BLAST matches to a protein in NCBI-nr (Materials and Methods). In (B) and (E), a kingdom is assigned if all eight highest-scoring BLAST matches agree in kingdom. In (C) and (F), all ORFs on a scaffold are assigned the same kingdom by voting among all ORFs with BLAST matches to NCBI-nr on that scaffold (Materials and Methods). In all graphs, only clusters with at least one assignable neighbor are considered. When compared to the size-matched controls, in all cases the GOS-only clusters show enrichment for viral sequences.
Figure 17
Figure 17. Content of Protease Types in NCBI-nr and GOS, and Kingdom Distribution of All Proteases
Due to the highly redundant nature of some NCBI-nr protease groups, nonredundant sets for both NCBI-nr and GOS are computed; these nonredundant sets are referred to as NCBI-nr60 and GOS60.
Figure 18
Figure 18. Content of Bacterial Protease Clans
None

Comment in

Similar articles

Cited by

References

    1. Tatusov RL, Galperin MY, Natale DA, Koonin EV. The COG database: A tool for genome-scale analysis of protein functions and evolution. Nucleic Acids Res. 2000;28:33–36. - PMC - PubMed
    1. Murzin AG, Brenner SE, Hubbard T, Chothia C. SCOP: A structural classification of proteins database for the investigation of sequences and structures. J Mol Biol. 1995;247:536–540. - PubMed
    1. Orengo CA, Michie AD, Jones S, Jones DT, Swindells MB, et al. CATH—A hierarchic classification of protein domain structures. Structure. 1997;5:1093–1108. - PubMed
    1. Thornton JM, Orengo CA, Todd AE, Pearl FM. Protein folds, functions and evolution. J Mol Biol. 1999;293:333–342. - PubMed
    1. Todd AE, Orengo CA, Thornton JM. Evolution of function in protein superfamilies, from a structural perspective. J Mol Biol. 2001;307:1113–1143. - PubMed

Publication types