. 2007 Jun 1;404(2):345-51.
doi: 10.1042/BJ20061609.

Were inefficient mitochondrial haplogroups selected during migrations of modern humans? A test using modular kinetic analysis of coupling in mitochondria from cybrid cell lines

Affiliations

Were inefficient mitochondrial haplogroups selected during migrations of modern humans? A test using modular kinetic analysis of coupling in mitochondria from cybrid cell lines

Taku Amo et al. Biochem J. .

Abstract

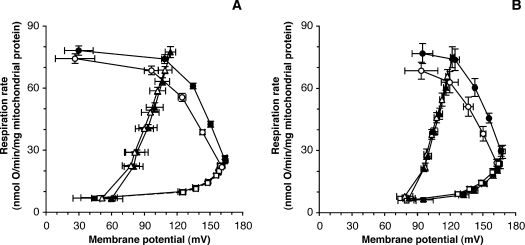
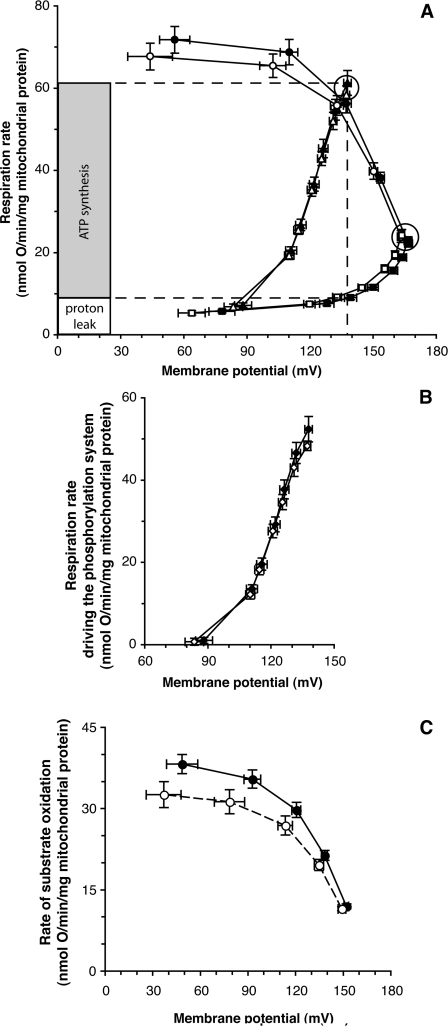
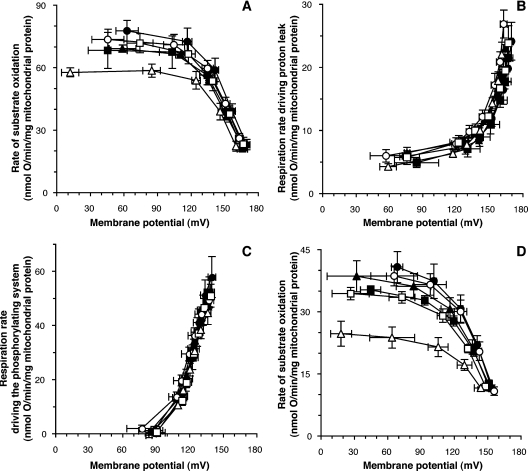
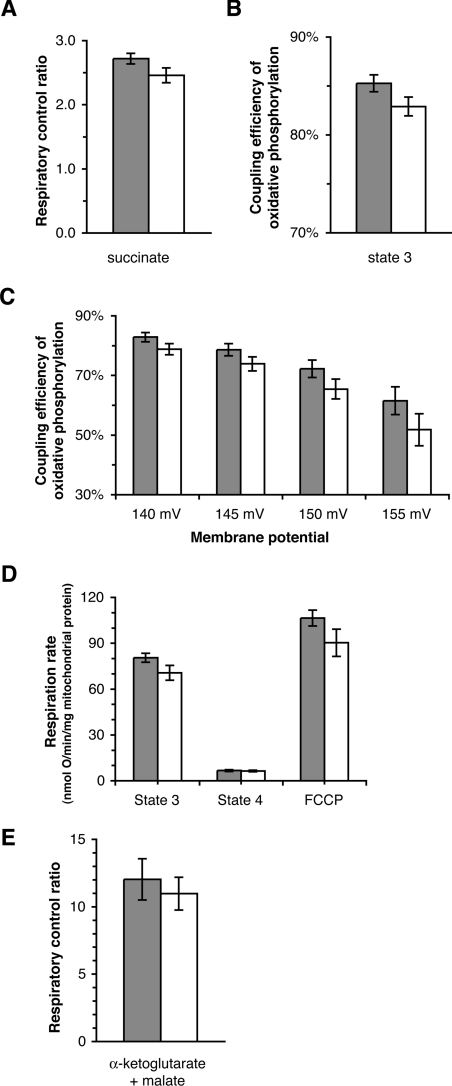
We introduce a general test of the bioenergetic importance of mtDNA (mitochondrial DNA) variants: modular kinetic analysis of oxidative phosphorylation in mitochondria from cybrid cells with constant nuclear DNA but different mtDNA. We have applied this test to the hypothesis [Ruiz-Pesini, Mishmar, Brandon, Procaccio and Wallace (2004) Science 303, 223-226] that particular mtDNA haplogroups (specific combinations of polymorphisms) that cause lowered coupling efficiency, leading to generation of less ATP and more heat, were positively selected during radiations of modern humans into colder climates. Contrary to the predictions of this hypothesis, mitochondria from Arctic haplogroups had similar or even greater coupling efficiency than mitochondria from tropical haplogroups.


Figures

Figure 1
Figure 1. Modular kinetic analysis: validation of the method
The Figures shows a modular kinetic analysis of the kinetic responses of the three modules of oxidative phosphorylation [substrate oxidation, circles; proton leak, squares; Δψ-consumers (sum of phosphorylating system and proton leak), triangles] to membrane potential, Δψ, in mitochondria isolated from cybrids, using 4 mM succinate as substrate. (A) Kinetic responses in mitochondria isolated from A, D, L1 and L2 cybrids in the absence (closed symbols) or presence (25 nM; open symbols) of the Complex III inhibitor myxothiazol. Results are means±S.E.M. for four independent mitochondrial preparations. The kinetics of substrate oxidation were significantly different at membrane potentials above 98 mV. (B) Kinetic responses in mitochondria isolated from cybrids harbouring a pathogenic mutation at np 3243 in the tRNA-Leu(UUR) gene (MTTL1). Closed symbols, clone Z (high proportion of wild-type); open symbols, clone X (high proportion of mutant). Results are means±S.E.M. for three independent mitochondrial preparations. The kinetics of substrate oxidation were significantly different at all membrane potentials.
Figure 2
Figure 2. Modular kinetic analysis: averaged values
The Figure shows a modular kinetic analysis of the kinetic responses of the three modules of oxidative phosphorylation to membrane potential, Δψ, in mitochondria isolated from cybrids. Closed symbols, Arctic haplogroups (A, C and D); open symbols, tropical haplogroups (L1, L2 and L3). (A) Succinate as substrate. A comparison of the kinetic responses of substrate oxidation (circles; Δψ titrated with the uncoupler FCCP), proton leak (squares; Δψ titrated with inhibitor, malonate), and Δψ-consumers (sum of phosphorylating system and proton leak, triangles; Δψ titrated with malonate) is shown. The points circled represent State 3 (maximal ATP synthesis) and State 4 (ATP synthesis) conditions. The coupling efficiency of oxidative phosphorylation (percentage of respiration used for ATP synthesis at a given Δψ) was calculated from the kinetic curves: the inset histogram shows the example of Arctic haplogroups at the Δψ of State 3. (B) Kinetic response of the phosphorylating system to Δψ, calculated from (A) by subtracting respiration driving proton leak from respiration driving the Δψ-consumers at each Δψ. (C) Kinetic response of substrate oxidation using 3.2 mM α-oxoglutarate+0.8 mM malate as substrate, with rotenone omitted. Results are means±S.E.M. for nine cell clones (three different clones for each of the three constituent haplogroups). There were three or four (A, B and C) or one (D) independent mitochondrial preparation(s) per clone.
Figure 3
Figure 3. Modular kinetic analysis: full dataset
The Figure shows modular kinetic analysis in mitochondria isolated from cybrids, using succinate as substrate, of (A) substrate oxidation, (B) proton leak and (C) the phosphorylating system. (D) Modular kinetic analysis of substrate oxidation using α-oxoglutarate+malate as substrate. Closed symbols, Arctic haplogroups (circles, haplogroup A; squares, haplogroup C; triangles, haplogroup D); open symbols, tropical haplogroups (circles, haplogroup L1; squares, haplogroup L2; triangles, haplogroup L3). Data are means±S.E.M. for three cell clones; there were three or four (A, B and C) or one (D) repeat(s) using independently prepared mitochondria for each clone. The kinetic response of the phosphorylating system to Δψ was calculated by subtracting respiration driving proton leak from respiration driving the Δψ-consumers at each value of Δψ.
Figure 4
Figure 4. Coupling efficiency of oxidative phosphorylation in mitochondria isolated from cybrids
Closed bars, Arctic haplogroups (A, C and D); open bars, tropical haplogroups (L1, L2 and L3). (A) Respiratory control ratio (State 3 respiration rate/State 4 respiration rate) using succinate as substrate. (B) Coupling efficiency using succinate as substrate at the Δψ of State 3. (C) Coupling efficiency using succinate as substrate at selected Δψ values between that at State 3 and that at State 4. Values at 145 mV or less were significantly different from values at 155 mV. (D) Respiration rates with α-oxoglutarate+malate as substrate. (E) Respiratory control ratio using α-oxoglutarate+malate as substrate. Results are means±S.E.M. for nine cell clones (three different clones for each of the three constituent haplogroups); there were three or four (A, B and C) or one (D and E) independent mitochondrial preparation(s) per clone. Values in (A, B and C) were calculated from the results shown in Figure 2(A).

Comment in

References

    1. Taylor R. W., Turnbull D. M. Mitochondrial DNA mutations in human disease. Nat. Rev. Genet. 2005;6:389–402. - PMC - PubMed
    1. Dimauro S., Davidzon G. Mitochondrial DNA and disease. Ann. Med. 2005;37:222–232. - PubMed
    1. Ruiz-Pesini E., Lapena A. C., Diez-Sanchez C., Perez-Martos A., Montoya J., Alvarez E., Diaz M., Urries A., Montoro L., Lopez-Perez M. J., Enriquez J. A. Human mtDNA haplogroups associated with high or reduced spermatozoa motility. Am. J. Hum. Genet. 2000;67:682–696. - PMC - PubMed
    1. Montiel-Sosa F., Ruiz-Pesini E., Enriquez J. A., Marcuello A., Diez-Sanchez C., Montoya J., Wallace D. C., Lopez-Perez M. J. Differences of sperm motility in mitochondrial DNA haplogroup U sublineages. Gene. 2006;368:21–27. - PubMed
    1. Baudouin S. V., Saunders D., Tiangyou W., Elson J. L., Poynter J., Pyle A., Keers S., Turnbull D. M., Howell N., Chinnery P. F. Mitochondrial DNA and survival after sepsis: a prospective study. Lancet. 2005;366:2118–2121. - PubMed

Publication types