. 2007 May;101(4):937-48.
doi: 10.1111/j.1471-4159.2007.04469.x. Epub 2007 Mar 12.

At diabetes-like concentration, glucose down-regulates the placental serotonin transport system in a cell-cycle-dependent manner

Affiliations

At diabetes-like concentration, glucose down-regulates the placental serotonin transport system in a cell-cycle-dependent manner

R Unal et al. J Neurochem. 2007 May.

Retraction in

  • Retraction.
    [No authors listed] [No authors listed] J Neurochem. 2020 Apr;153(1):138. doi: 10.1111/jnc.14931. Epub 2020 Feb 17. J Neurochem. 2020. PMID: 32202334 Free PMC article.

Abstract

Serotonin [5-hydroxytryptamine (5HT)] is a vasoconstrictor that also acts as a developmental signal early in embryogenesis. The 5HT transporter (SERT) on the membranes of the placental trophoblast cells controls 5HT levels in the maternal bloodstream to maintain stable transplacental blood flow and simultaneously provide 5HT to the embryo. The 5HT uptake rate of placental SERT is important for both the mother and the developing embryo. The impact of glucose on the placental SERT system during diabetic pregnancy is not known. The present in vitro study investigated this important issue in human placental choriocarcinoma (JAR) cells that were cultured for 24-96 h in a medium containing either 5.5 (physiologic concentration) or 25 mmol/L D-glucose (diabetic-like concentration). The 5HT uptake rates of the cultured cells were not altered at exogenous D-glucose concentrations in the range of 5.5-15 mmol/L, but were decreased significantly at a diabetic-like concentration (>or=25 mmol/L). To understand better the role of glucose on the placental 5HT system, we first characterized SERT in JAR cells at different cell-cycle phases and then determined the expression levels of SERT on the plasma membrane and in the intracellular pools of JAR cells at the late-S and G2 phases, where the uptake rates were decreased 73% under diabetic-like glucose concentrations. Finally, the importance of self-association of SERT molecules was examined. In JAR cells co-expressing Flag- and myc-tagged SERT, myc-antibody precipitated 70% of Flag-SERT, indicating that a large percentage of SERT proteins exist as oligomers in situ. Under diabetic conditions, myc-antibody no longer precipitated Flag-SERT, suggesting a disruption in the aggregation of SERT molecules. Therefore, we propose that under uncontrolled diabetic conditions, glucose down-regulates 5HT uptake rates of placental SERT by interfering with its functional expression in a cell-cycle-dependent manner.


Figures
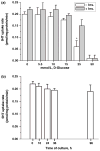
Fig. 1
Fig. 1
Characterization of SERT in JAR cells with glucose at different concentrations. (a) JAR cells were cultured in RPMI supplemented with 10% FBS with/without insulin and D-glucose at different concentrations, 5.5, 10, 15, 25 mmol/L. The [3H]-5HT uptake rate in intact cells was measured as described in the Methods section. Results are expressed as a percentage of uptake after pre-treatment without glucose (percentage of control). Significant differences in 5HT uptake rates of JAR cells between 25 mmol/L glucose and physiological levels of glucose were observed in the absence of insulin, as shown by asterisks (*, p < 0.001). A two-way independent factorial analysis of variance was conducted to investigate 5HT uptake rate of SERT differences in insulin and glucose categories; ANOVA results, presented in Table 1. (b) The time-course effect of 5.5 mmol/L D-glucose on SERT in JAR cells cultured in insulin-free RPMI supplemented with 5.5 mmol/L D-glucose for 0, 10, 24, 36, for 96 h was also measured. Rates of uptake are expressed as means of SD values of triplicate determinations from three independent experiments.
Fig. 2
Fig. 2
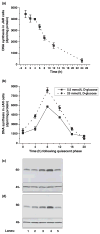
Cell-cycle analysis of JAR cells. JAR cells were brought into the quiescent phase through serum deprivation and incubated in [3H]-thymidine to measure the DNA synthesis as described in the Methods section (a). To estimate the times for the phases during the cell cycle, quiescent cells were taken back to the insulin-free full medium supplemented with 5.5 (dotted line) or 25 mmol/L D-glucose (solid line). (b) The estimated time of the phases in the cell cycle is summarized in Table 2. The results reported here are the mean and SD of three separate experiments. Quiescent JAR cells were incubated in insulin-free full RPMI medium containing 5 mmol/L (c) or with 25 mmol/L D-glucose-supplemented RPMI medium (d); after 4, 8, 12, 16, or 24 h (lanes 1–5, respectively), a group of cells was harvested and prepared for western blotting with cyclin B-antibody. Actin was used as a loading control (inset in the figures 45 kD). The immunoblots are representative of at least three independently performed experiments.
Fig. 3
Fig. 3
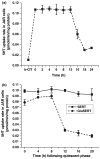
5HT Uptake profile of hSERT in JAR cells at different phases with 5.5 or 25 mmol/L D-glucose. [3H]-5HT uptake was measured in intact JAR cells placed into the quiescent phase through serum deprivation (a) The quiescent JAR cells were entered into the cell-cycle phases in full RPMI supplemented with 10% FBS (without insulin) and 5.5 or 25 mmol/L D-glucose. The 5HT uptake rate of SERT was monitored in these cells every 4 h as described in the Methods section (b) Rates of uptake are expressed as means of SD values of triplicate determinations from three independent experiments.
Fig. 4
Fig. 4
Concentration-dependent effect of exogenous D-glucose on relative SERT mRNA in JAR cells. JAR cells were cultured in RPMI supplemented with 10% FBS without insulin and D-glucose at different concentrations, 5.5, 10, 15, 25 mmol/L (lanes 2–5). The relative SERT mRNA levels were measured. Reactions without cDNA (lane 1) or only H2O (not shown in the figure) were used as negative controls. (a) shows the representative of four different experiments. The band densities were calculated as the ratio of each band to the transcription level of β-actin (b) Relative mRNA levels are expressed as means of SD values of triplicate determinations from three independent experiments.
Fig. 5
Fig. 5
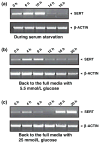
Relative SERT mRNA levels in different JAR cell-cycle phases. SERT mRNA levels were monitored by semi-quantitative RT-PCR analysis during serum starvation (a) and the entrance of quiescent cells into various phases of the JAR cell cycle in the presence of 5.5 mmol/L (b) or with 25 mmol/L D-glucose (c) containing full RPMI supplemented with 10% FBS without insulin. The images are representatives of at least four to five independently performed experiments.
Fig. 6
Fig. 6
Whole-cell and surface expression of hSERT in JAR cells entered into the G2phase with or without 25 mmol/L D-glucose-containing full medium. (a) For whole-cell expression, JAR cells entered the G2 phase in insulin-free full RPMI supplemented with 5.5 (lanes 2 and 4) or 25 mmol/L D-glucose (lanes 1 and 3); 50 μL cell lysate was separated by SDS–PAGE and visualized by western blotting, and the integrated density values were determined by densitometry. The standard curve for quantification of hSERT expression was prepared as described previously (Kilic and Rudnick 2000). For cell-surface expression, JAR cells entered the G2 phase in insulin-free full RPMI medium supplemented with 5.5 (lane 3) or 25 mmol/L glucose (lane 4); then the intact cells were biotinylated. The labeled cell surface proteins were separated and visualized as above. The immunoblots are representatives of three independently performed experiments. (b) The results from western blotting are shown above a summary of combined data from three densitometric scans. All lanes contain protein recovered from the same number of cells equivalent to 30% of one well from a confluent 6-well dish. Three wells of each condition were pooled and an aliquot of this mixture was run on the gel.
Fig. 7
Fig. 7
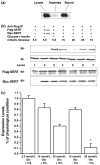
Self-association ability of SERT proteins under different glucose concentrations. (a) The significance of self-association of SERT molecules in JAR cells was tested. The extent of myc-SERT depletion from the cell lysate on immunoprecipitation of Flag-SERT was measured. Lysate from JAR cells expressing a 1: 1 mixture of myc-SERT/Flag-SERT was first pre-cleared and a sample of the pre-cleared lysate was separated by SDS–PAGE and was assayed by western blotting with anti-myc-antibodies (lysate). An equivalent sample of the same lysate was analyzed after treatment with an amount of protein A beads and Flag-antibody that was independently determined to maximally precipitate myc-SERT from the mixture (depleted). From three independent experiments, the precipitation removed 70 ± 2% of the myc-SERT from solution (bound). (b) JAR cells were co-transfected with SERT-Flag and myc-SERT constructs in a 1: 1 ratio where indicated. Transfection medium was replaced with insulin-free full RPMI containing 5.5, 15, or 25 mmol/L D-glucose (lanes 3, 7, 5). The impact of insulin in FBS on exogenous glucose was tested with co-immunoprecipitation of myc-SERT/Flag-SERT expressing JAR cells. Cells were cultured and co-transfected as described in the text. Following transfection, cells were incubated in full RPMI supplemented with 5.5 or 25 mmol/L glucose (lanes 4 and 6, respectively). After 24 h, co-transfected cells were harvested, solubilized, and treated with mouse anti-myc-antibody coated RAM-PAS beads. The immunoprecipitates were separated and blotted with polyclonal anti-Flag-antibodies. Control experiments in which only SERT-Flag transfected JAR cells were subjected to the same procedure did not reveal a visible band (lane 1) in the immunoblot. Another control experiment was the analysis of lysates from D-glucose-treated JAR cells expressing myc-SERT or Flag-SERT individual constructs which were mixed prior to immunoprecipitation (lane 2). Equal amounts of samples from the pre-cleared cell lysates prior to immunoprecipitation were resolved on two identical SDS–PAGE and analyzed by western blot. One of the blots was probed with anti-myc-antibody, while the other blot was probed with anti-Flag- antibody as the control for the whole-cell expressions of these two forms of SERT. The positions of molecular weight standards are indicated (in kD). After immune complexes were recovered by brief centrifugation, equal amounts of supernatant were resolved on SDS–PAGE and analyzed by western blotting with anti-actin-antibody as a loading control. The inset in the representative blots shows that all lanes contain protein recovered from the same number of cells equivalent to 30% of one 100-mm culture plate. The immunoblots are representatives of three independently performed experiments. (c) The results from the western blots are shown above a summary of combined data from three densitometric scans. All lanes contain protein recovered from the same number of cells equivalent to 30% of one 100-mm culture dish. *p < 0.001.

Similar articles

Cited by

References

    1. Balkovetz DF, Tiruppathi C, Leibach FH, Mahesh VB, Ganapathy V. Evidence for an imipramine-sensitive serotonin transporter in human placental brush-border membranes. J Biol Chem. 1989;264:2195–2198. - PubMed
    1. Bengel D, Murphy DL, Andrews AM, Wichems CH, Feltner D, Heils A, Mossner R, Westphal H, Lesch K. Altered brain serotonin homeostasis and locomotor insensitivity to 3,4-methylenedioxymethamphetamine (“Ecstasy”) in serotonin transporter-deficient mice. Mol Pharmacol. 1998;53:649–655. - PubMed
    1. Blakely RD, Berson HE, Fremeau RT, Jr, Caron MC, Peek MM, Priace HK, Bradley CC. Cloning and expression of a functional serotonin transporter from rat brain. Nature. 1991;354:66–70. - PubMed
    1. Brownlee M. Biochemistry and molecular cell biology of diabetic complications. Nature. 2001;414:813–820. - PubMed
    1. Cases O, Vitalis T, Seif I, De Maeyer E, Sotelo C, Gaspar P. Lack of barrels in the somatosensory cortex of monoamine oxidase A-deficient mice: role of a serotonin excess during the critical period. Neuron. 1996;16:297–307. - PubMed

Publication types

MeSH terms