. 2007;35(7):2191-8.
doi: 10.1093/nar/gkm118. Epub 2007 Mar 13.

Epigenetic disruption of ribosomal RNA genes and nucleolar architecture in DNA methyltransferase 1 (Dnmt1) deficient cells

Affiliations

Epigenetic disruption of ribosomal RNA genes and nucleolar architecture in DNA methyltransferase 1 (Dnmt1) deficient cells

Jesús Espada et al. Nucleic Acids Res. 2007.

Abstract

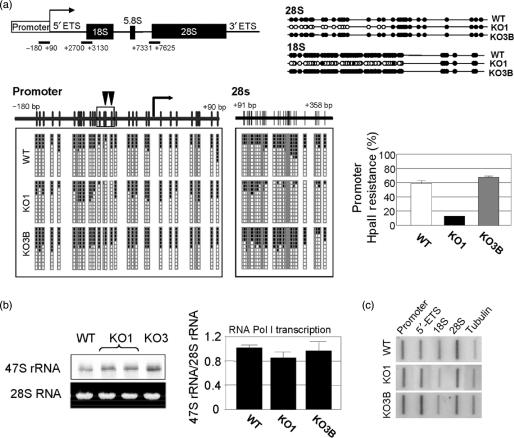
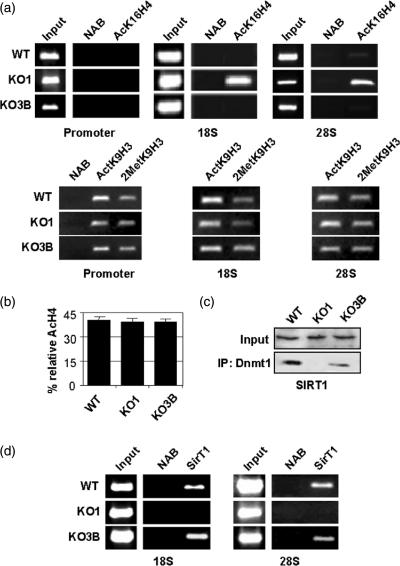
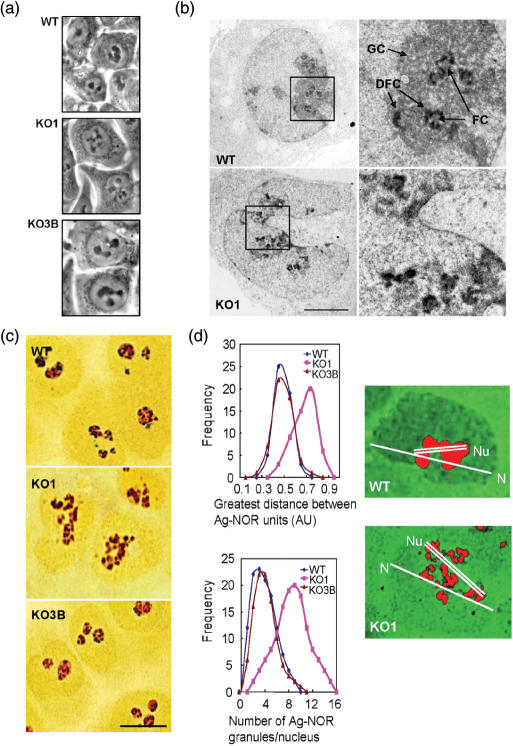
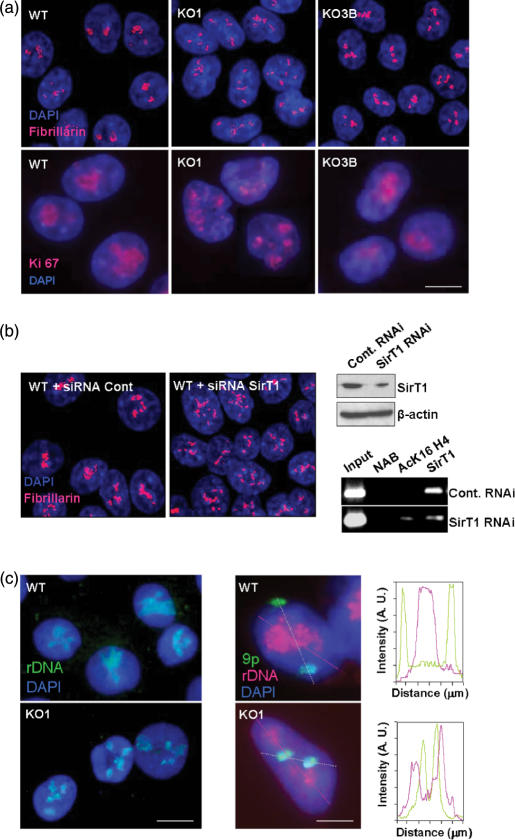
The nucleolus is the site of ribosome synthesis in the nucleus, whose integrity is essential. Epigenetic mechanisms are thought to regulate the activity of the ribosomal RNA (rRNA) gene copies, which are part of the nucleolus. Here we show that human cells lacking DNA methyltransferase 1 (Dnmt1), but not Dnmt33b, have a loss of DNA methylation and an increase in the acetylation level of lysine 16 histone H4 at the rRNA genes. Interestingly, we observed that SirT1, a NAD+-dependent histone deacetylase with a preference for lysine 16 H4, interacts with Dnmt1; and SirT1 recruitment to the rRNA genes is abrogated in Dnmt1 knockout cells. The DNA methylation and chromatin changes at ribosomal DNA observed are associated with a structurally disorganized nucleolus, which is fragmented into small nuclear masses. Prominent nucleolar proteins, such as Fibrillarin and Ki-67, and the rRNA genes are scattered throughout the nucleus in Dnmt1 deficient cells. These findings suggest a role for Dnmt1 as an epigenetic caretaker for the maintenance of nucleolar structure.


Figures

Figure 1.
Figure 1.
DNA methylation analyses at the rRNA genes in Dnmt1 deficient cells and rDNA transcription rate. (a) Schematic representation of the rRNA gene, depicting three regions along the gene repeat: the proximal promoter, including the transcription start site, and the initial sections of the 18S and 28S regions, subjected to bisulfite genomic sequencing. Methylated and nonmethylated CpG positions are represented as black and white circles, respectively. Twelve different clones are shown. For the promoter, a cluster of four CpG dinucleotides are specifically demethylated in KO1 cells. Left, quantification of the resistance to methylation-dependent HpaII digestion in the described rDNA promoter region. (b) Left, northern-blot analysis of the expression of the precursor 47S rRNA transcript in duplicate samples. The expression of the 28S RNA was included as an internal loading control. Right, RT-PCR quantitative analysis of the expression of the 47S precursor with respect to the 28S rRNA as a measure of RNA Pol I transcription. (c) Run-on experiments of transcriptional activity in four regions of the rRNA gene. The tubulin promoter was included as control for normalization purposes.
Figure 2.
Figure 2.
Dnmt1 deficiency results in increased AcK16H4 and loss of SirT1 recruitment to rDNA gene regions. (a) ChIP analysis of the distribution of acetylated lysine 16 histone H4 (AcK16H4) (upper panels), acetylated lysine 9 histone H3 (AcK9H3) and di-methylated lysine 9 histone H3 (MetK9H3) (lower panels) in three regions along the rRNA gene (Promoter, 18S and 28S) showing a specific increase of AcK16H4 in the 18S and 28S regions in KO1 cells. For each protein, results are representative of at least two experiments. Input and nonantibody (NAB) lanes are also shown. (b) HPCE quantification of the overall content of acetylated histone H4 in showing no significant differences between cell lines. (c) Immunoprecipitation assay of human Dnmt1 showing its association with human sirtuin1 (SirT1), that it is lost in KO1 cells. (d) ChIP analysis of the distribution of human SirT1 in 18S and 28S regions of the rDNA genes showing loss of SirT1 occupancy in Dnmt1 deficient cells.
Figure 3.
Figure 3.
Structural disorganization of the nucleolar compartment in human cells lacking Dnmt1. (a) Phase-contrast images of living cells showing the pattern of nucleolar organization in WT and KO3B cells, and the distortion of this pattern in KO1 cells, showing the fragmentation of the nucleolar compartment into several small spots. (b) Ultrastructural analysis of the nucleolar compartment after uranyl–EDTA-lead staining of ribonucleoproteins, showing the classical pattern of nucleolar organization in Fibrillar Centers (FC), Dense Fibrillar Component (DFC) and Granular Components (GC) in WT cells (similar in KO3B cells) and the distortion of this pattern in KO1 cells. Images in right panel are enlarged views of the region delimited by the squares in the left panel. Bar: 5 μm. (c) Selective Ag-NOR staining showing the morphological changes of the nucleolus in KO1 cells. Bar: 10 μm. (d) Left, degree of dispersion of nucleolar components in WT, KO1 and KO3B cells, measured as the increase of both the distance between Ag-NOR granules (upper) and the number of Ag-NOR granules per nucleus (lower). Right, example of pseudocolor images obtained from Ag-NOR-stained WT and KO1 cells, depicting the two cellular parameters, nuclear (N) and nucleolar (Nu) distances, used to calculate the degree of dispersion of nucleolar components.
Figure 4.
Figure 4.
Immunolocalization of nucleolar proteins and FISH analyses of rRNA genes in Dnmt1 deficient cells. (a) Fibrillarin and Ki-67 immunolocalization (red) and DAPI-stained nuclei (blue). In all cell lines, fibrillarin and Ki-67 were found in close association with nucleolar masses, showing the fragmentation of the nucleolar compartment in several masses of reduced size in KO1 cells. (b) Left, RNA interference knockdown of SirT1 in wild-type HCT-116 cells induces a disorganization of the nucleolus detected by immunolocalization of the prominent nucleolar protein Fibrillarin. Right, SirT1 interference is demonstrated by western blot (top) and an illustrative ChIP analyses of 18S rRNA region demonstrates loss of Sirt1 occupancy and increased AcK16H4 in the SirT1 depleted cells (down). (c) Left panels: fluorescence-microscopy images of a 2D-FISH analysis showing the distribution of rRNA genes (green) in DAPI-stained nuclei (blue). rRNA genes were found to be grouped in one to three large, definite clusters in WT cells. In contrast, rRNA genes were dispersed in several clusters scattered throughout the nucleus in KO1 cells. Middle panels: fluorescence-microscopy images of a 3D-FISH analysis showing the distribution of rRNA genes (red) and the p-arm of the chromosome 9 (green) in DAPI-stained nuclei (blue). Right panels represent the densitometric analysis of red and green light intensity through the lines depicted in the middle panel.

References

    1. Henderson AS, Warburton D, Atwood KC. Location of ribosomal DNA in the human chromosome complement. Proc. Natl. Acad. Sci. USA. 1972;69:3394–3398. - PMC - PubMed
    1. Carmo-Fonseca M, Mendes-Soares L, Campos I. To be or not to be in the nucleolus. Nat. Cell Biol. 2000;2:E107–E112. - PubMed
    1. Grummt I, Pikaard CS. Epigenetic silencing of RNA polymerase I transcription. Nat. Rev. Mol. Cell Biol. 2003;4:641–649. - PubMed
    1. McStay B. Nucleolar dominance: a model for rRNA gene silencing. Genes Dev. 2006;20:1207–1214. - PubMed
    1. Santoro R. The silence of the ribosomal RNA genes. Cell. Mol. Life. Sci. 2005;62:2067–2079. - PMC - PubMed

Publication types