. 2007 Mar 14;2(3):e293.
doi: 10.1371/journal.pone.0000293.

Precancerous stem cells have the potential for both benign and malignant differentiation

Affiliations

Precancerous stem cells have the potential for both benign and malignant differentiation

Li Chen et al. PLoS One. .

Abstract

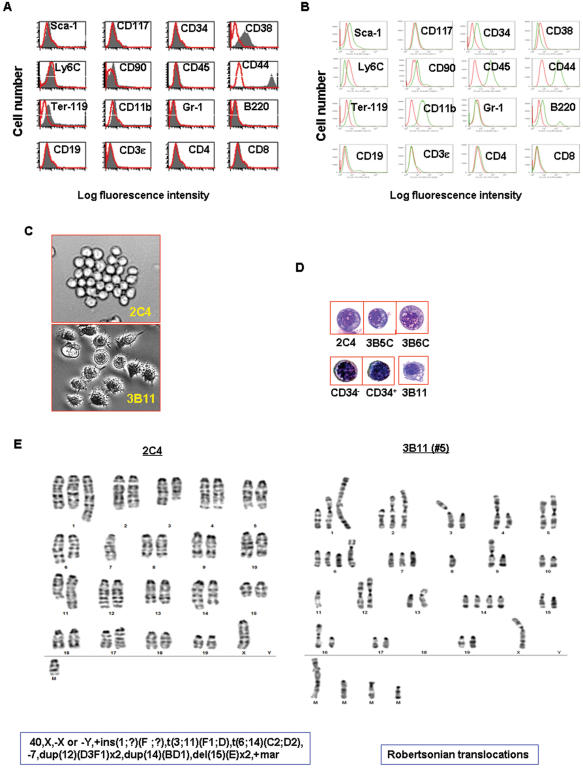
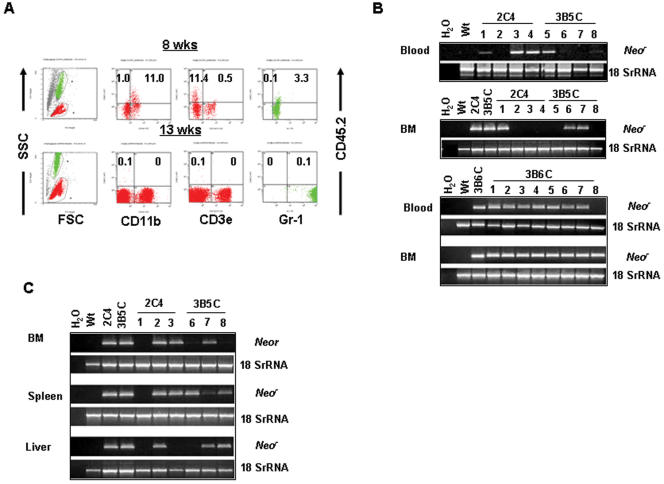
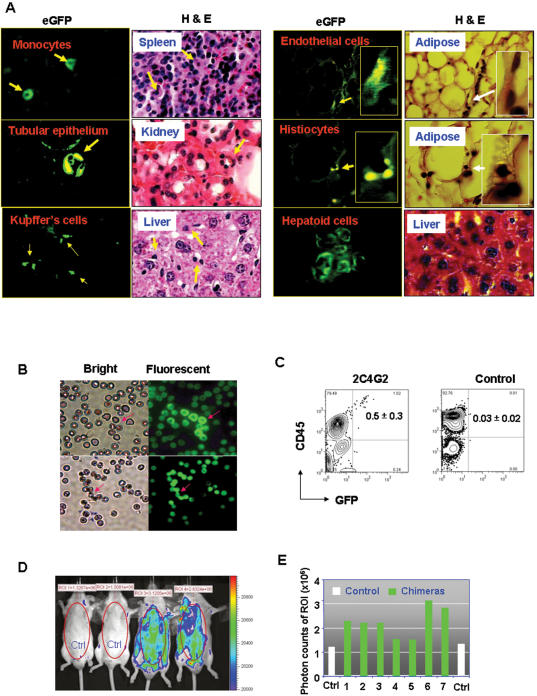
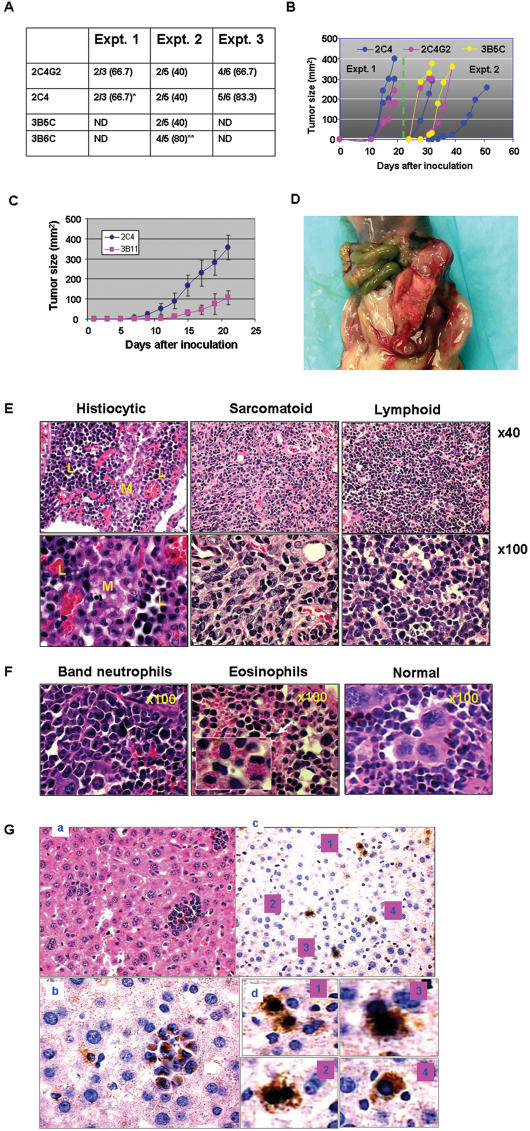
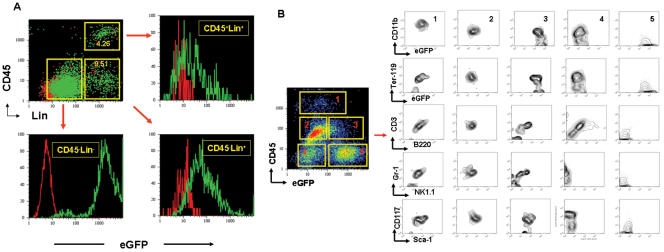
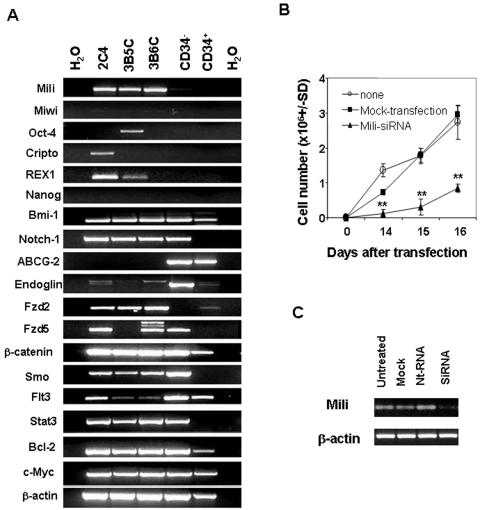
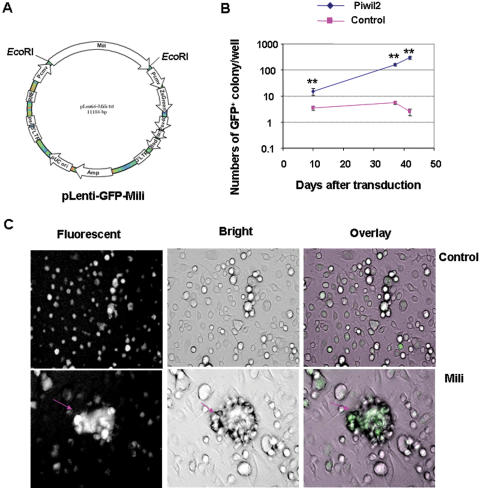
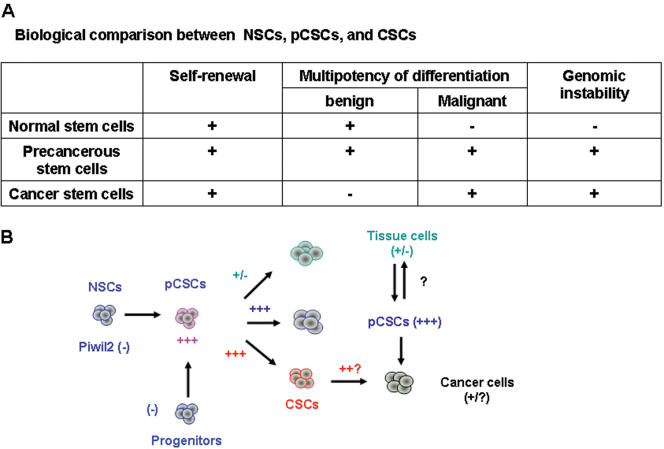
Cancer stem cells (CSCs) have been identified in hematopoietic and solid tumors. However, their precursors-namely, precancerous stem cells (pCSCs) -have not been characterized. Here we experimentally define the pCSCs that have the potential for both benign and malignant differentiation, depending on environmental cues. While clonal pCSCs can develop into various types of tissue cells in immunocompetent mice without developing into cancer, they often develop, however, into leukemic or solid cancers composed of various types of cancer cells in immunodeficient mice. The progress of the pCSCs to cancers is associated with the up-regulation of c-kit and Sca-1, as well as with lineage markers. Mechanistically, the pCSCs are regulated by the PIWI/AGO family gene called piwil2. Our results provide clear evidence that a single clone of pCSCs has the potential for both benign and malignant differentiation, depending on the environmental cues. We anticipate pCSCs to be a novel target for the early detection, prevention, and therapy of cancers.


Conflict of interest statement

Competing Interests: The authors have declared that no competing interests exist.

Figures

Figure 1
Figure 1. Phenotypical and cytological characterization of pCSCs.
A & B, The phenotype of pCSC clones (A) and monocytic cell clones (B) from the same mouse (14): the data shown are a representative of pCSC (2C4; A) and monocytic clones (3B11; B). The phenotype of the 2C4 clone was similar to 3B5C and 3B6C clones (not shown). Red histograms represent isotype mAbs (A & B), and black (A) or green (B) histograms represent specific mAbs. C, Phase contrast micrographs: a representative (2C4) of 3 pCSC clones (top panel) and differentiated DC-like clone (3B11) from the same mouse (bottom panel; original magnification ×200). D, Comparison of cytology between the pCSCs, 3B11, and HSCs: HSC-enriched CD34Lin and CD34+Lin cells were sorted by FACSorter from the BM of B6 mice (Wright-Giemsa staining; original magnification ×1000). DC-like cell line 3B11 was derived from the same mouse of the pCSCs. E, The karyotype of pCSCs: a representative of 2C4 clone that exhibits a pseudodiploid karyotype with multiple chromosomal translocations identical to the 3B5C and 3B6C clones (not shown). Left panel: karyotype of the 2C4 clone; right panel: an example of Robertsonian translocations in the 3B11 clone.
Figure 2
Figure 2. pCSCs have long-term repopulating activity.
Congenic CD45.1 B6 mice were lethally irradiated and injected i.v. with 0.5∼1×10⁶ 2C4, 3B5C or 3B6C cells along with 2∼5×10⁵ recipient-type BM cells. Donor-specific CD45.2+ lymphoid (CD3ε+) and myeloid (CD11b+ or Gr-1+) cells were monitored by flow cytometric analysis of blood cells starting from 4 wks post transfer, once every two wks, until 18 wks (A). The mice were sacrificed 10 moths post transfer, and the blood and BM cells were collected for HANDS-Nested DNA PCR to identify donor-derived cells (B). To verify the self-renewal capability of the long-term repopulated donor cells, 1×10⁶ BM cells from the primary recipients were injected i.v. into the secondary recipients, which were sacrificed 10 wks post transfer. The pCSC-derived neor gene in the BM, liver, and spleen was determined by HANDS-Nested DNA PCR (C). The data shown in B are from a recipient with transient expansion of pCSC-derived hematopoietic cells at 8 and 13 wks post transfer, and the data shown in C & D are from one of 3 experiments (5∼10 mice/group/expt).
Figure 3
Figure 3. pCSCs can differentiate into various type of tissue cells.
A, Differentiation of pCSCs into hematopoietic and non-hematopoietic cells: The lethally irradiated CD45.1 congenic B6 mice were injected i.v. with 1×10⁶ 2C4 (n = 5) or eGFP+ 2C4G2 cells (n = 10), along with 5×10⁵ recipient-type BM cells, as described above. The mice were sacrificed 5 months post transfer. Various organs, including the liver, kidney, spleen and adipose tissues were harvested, fixed in 10% formaldehyde of PBS, prepared for H & E. staining, and examined under fluorescent microscope. At least three discontinuous sections (100 µm/step) were examined for each organ to ensure that eGFP+ cells were identified under the fluorescent microscope. The morphology of eGFP+ cells was determined under the bright field of the fluorescent microscope (original magnification ×1000). B–E, Development of pCSCs in blastocyst chimeric mice: E3.5 dpc of FVB mice were injected with 2C4G2 (8∼10 cells per blastocyst) and transferred to pseudopregnant surrogate mothers. The progeny were delivered and grew to adult without any complication. The data shown are from one of two experiments in which 8 progeny (male: n = 6; female: n = 2) were obtained. One male mouse died of fighting at 3 months of age. B, eGFP+ RBCs in 7/8 of the chimeric mice: The data represent the air-dried blood smears from two mice, at the age of 2 months, examined under, respectively, the bright and fluorescent fields of a fluorescent microscope (Nike, E400, Japan). C, pCSC-derived eGFP+CD45+ cells: peripheral blood was harvested from the chimeric mice at age 2 months (n = 6; other two pregnant mice were not examined) or control FVB mice (n = 10), stained with PE-conjugated mAb to CD45, and analyzed by flow cytometry. D & E, Living image of the chimeric mice: A representative living image of the chimeric mice at 4 months of age is shown in D, demonstrated by IVIS imaging systems incorporated with Living Imaging® software (Xenogen Inc.); and the eGFP-derived photon counts in the region of interest (ROI) of 7 mice are shown in E. Normal FVB mice were used as control for living imaging.
Figure 4
Figure 4. pCSCs developed into various type of tumors in immunodeficient mice.
A, Tumor incidence from 3 experiments. Equal numbers of sex matched SCID mice were injected s.c. or i.p. with 5×10⁶ pCSCs. No significant difference in incidence was observed between s.c. and i.p. injected mice. As a control, C57BL/6 mice injected s.c. (n = 10) or i.p. (n = 10) with 2C4 cells did not develop tumors within 5 months of observation (data not shown) “*” indicates that a mouse developed ascites, “**” indicates that the 3B6C cells infiltrated in the liver and spleen (see E). B, Kinetics of tumor growth: the data shown are from experiments 1 & 2 in A. Each color in B corresponds to a specific cell line. C, Comparison of tumorigenesis between pCSCs (2C4) and differentiated cancer cells (3B11); (n = 10/group, each group includes 5 males and 5 females). D, A representative of gross tumors from a mouse injected i.p. with 3B5C clone. E, A histological representative of pCSC-derived tumors from the mice injected i.p. with 2C4 or 3B5C clones. F, A histological representative from the spleen of mice injected i.p. or s.c. with 3B6C clone. Note that megakaryocytes in the spleen of normal SCID mice were replaced by atypical neutrophils or eosinophils. G, Benign differentiation of pCSCs in the liver with metastatic cancers: (a) H & E staining of a liver section with metastatic cancers from a mouse injected i.p. with 2C4 cells (original magnification: ×200). (b) Immunohistochemical staining of the liver section from the same mouse with antibody to neomycin, showing neomycin+ cancer cells (original magnification: ×400). (c) Immunohistochemical staining of pCSC-derived hepatoid cells in the regenerative area of the liver sections from the same mouse (original magnification: ×200). (d) The enlarged micrographs of hepatoid cells demonstrated in (c).
Figure 5
Figure 5. Phenotypic alterations of pCSCs progressing to cancer.
Single tumor cells were either prepared and freshly stained with mAb to CD45 and a mixture of lineage-specific mAbs to CD3, CD11b, Ter-119, Gr-1 and B220 (A) or cultured for 2 d and stained with mAb to CD45 in combination with mAbs to lineage markers or to c-kit and Sca-1 as indicated (B). The samples were analyzed by three- (A) or four-color flow cytometry (B). The green and red dot plots or histograms represent, respectively, the tumor cells derived from eGFP+ 2C4G2 (green) and eGFP 2C4 (red) cells (A). Five populations (p1∼5) of tumor cells are identified based on the level of CD45 and eGFP expression (B).
Figure 6
Figure 6. Exclusive expression of piwil2 and embryonic stem cell-related genes in pCSCs.
A, Exclusive expression of mili (piwil2) gene in pCSCs: Total RNA was isolated randomly from 2C4, 3B5C and 3B6C cell cultures at various times or from the CD34+Lin and CD34Lin BM cells of B6 mice, which were purified by FACS Aria in 3 separate experiments, and was subject to RT-PCR analysis for embryonic, germ-line, and adult stem cell-related stemness genes and oncogenic genes. The data represent at least 3 experiments. B, Inhibition of pCSC expansion in vitro by mili-specific siRNA: 2C4 cells (100 cells/well) were either transfected or not by mili-specific siRNA (100 nMol) or mock-transfected in triplicate in 24-well plates. The cells were counted at indicated times. The data represent 5 experiments. **, p<0.01 as compared to the mock- or non-transfected groups. C, Knockdown of mili mRNA by mili-specific siRNA: 2C4 cells (1×10⁶/well) were transfected by mili-siRNA or scramble nucleotide (nt) RNA, and harvested 48 hrs post transfection. The expression of mili mRNA was revealed by RT-PCR. The data represent 3 experiments.
Figure 7
Figure 7. Ectopic expression of mili in BM cells promotes cell proliferation.
A. Schematic construct of Lenti-GFP-Mili viral vector. B, The effect of ectopic expression of mili on marrow cell proliferation: BM cells from B6 mice were transduced with Lenti-GFP-Mili or Lenti-GFP viruses in 24-well plates (n = 4 well/group), as described in Methods. The number of GFP+ colonies were counted at indicated times. **, p<0.01, compared to Lenti-GFP group. C, Representative eGFP+ EB-like colonies at day 10 post transduction (arrow). The micrographs were taken under the inverted fluorescent microscope (Nikon, TE2000-U, Japan), using original magnification: ×200.
Figure 8
Figure 8. The developmental relationship between pCSC, CSC and cancer.
A, Biological comparison between NSCs, pCSCs, and CSCs. B, Schematic model of pCSC development: piwil2 might play an important role in pCSC development.

References

    1. Reya T, Morrison SJ, Clarke MF, Weissman IL. Stem Cells, Cancer, and Cancer Stem Cells. Nature. 2001;414:105–11. - PubMed
    1. Wang JC, Dick JE. Cancer Stem Cells: Lessons from Leukemia. Trends Cell Biol. 2005;15:494–501. - PubMed
    1. Clarke MF, Dick JE, Dirks PB, Eaves CJ, Jamieson CH, et al. Cancer Stem Cells–Perspectives on Current Status and Future Directions: Aacr Workshop on Cancer Stem Cells. Cancer Res. 2006;66:9339–44. - PubMed
    1. Bonnet D, Dick JE. Human Acute Myeloid Leukemia Is Organized as a Hierarchy That Originates from a Primitive Hematopoietic Cell. Nat Med. 1997;3:730–7. - PubMed
    1. Al-Hajj M, Wicha MS, Benito-Hernandez A, Morrison SJ, Clarke MF. Prospective Identification of Tumorigenic Breast Cancer Cells. Proc Natl Acad Sci U S A. 2003;100:3983–8. - PMC - PubMed

Publication types

Substances