Comparative Study
. 2007 Feb;9(2):147-58.
doi: 10.1593/neo.06778.

Estrogen and resveratrol regulate Rac and Cdc42 signaling to the actin cytoskeleton of metastatic breast cancer cells

Affiliations
Comparative Study

Estrogen and resveratrol regulate Rac and Cdc42 signaling to the actin cytoskeleton of metastatic breast cancer cells

Nicolas G Azios et al. Neoplasia. 2007 Feb.

Abstract

Estrogen and structurally related molecules play critical roles in breast cancer. We reported that resveratrol (50 microM), an estrogen-like phytosterol from grapes, acts in an antiestrogenic manner in breast cancer cells to reduce cell migration and to induce a global and sustained extension of actin structures called filopodia. Herein, we report that resveratrol-induced filopodia formation is time-dependent and concentration-dependent. In contrast to resveratrol at 50 microM, resveratrol at 5 microM acts in a manner similar to estrogen by increasing lamellipodia, as well as cell migration and invasion. Because Rho GTPases regulate the extension of actin structures, we investigated a role for Rac and Cdc42 in estrogen and resveratrol signaling. Our results demonstrate that 50 microM resveratrol decreases Rac and Cdc42 activity, whereas estrogen and 5 microM resveratrol increase Rac activity in breast cancer cells. MDA-MB-231 cells expressing dominant-negative Cdc42 or dominant-negative Rac retain filopodia response to 50 microM resveratrol. Lamellipodia response to 5 microM resveratrol, estrogen, or epidermal growth factor is inhibited in cells expressing dominant-negative Rac, indicating that Rac regulates estrogen and resveratrol (5 microM) signaling to the actin cytoskeleton. These results indicate that signaling to the actin cytoskeleton by low and high concentrations of resveratrol may be differentially regulated by Rac and Cdc42.


Figures
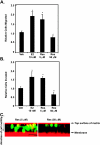
Figure 1
Figure 1
Effects of estrogen or resveratrol on cell migration and on the invasion of MDA-MB-231 cells. (A) Cell migration. Quiescent cells were placed on the top well of Transwell chambers in a serum-free medium using the following as chemoattractants on the bottom well for 8 hours: DMSO control (Veh), 10 nM estrogen (E2), or 5 or 50 µM resveratrol (Res). The number of cells that migrated through the membrane of the top well was quantified relative to control. Data are quantified from an analysis of 25 microscopic fields per treatment from six experiments and expressed as mean relative cells migrated ± SEM. *Statistical significance from control vehicle at P < .05. (B) Invasion. Quiescent cells were placed on the top well of Transwell chambers where the membrane was coated with Matrigel. The bottom well contained DMSO (Veh), 10 nM estrogen (E2), or 5 or 50 µM resveratrol (Res). The number of cells that migrated through the Matrigel matrix after 24 hours of incubation was quantified and made relative to control. Data are quantified from an analysis of 25 microscopic fields per treatment from four experiments and expressed as mean relative cells migrated ± SEM. *Statistical significance from control vehicle at P < .05. (C) Cells invading through the Matrigel matrix. Representative images of MDA-MB-231 cells invading the interface (∼ 30 µM) of the Matrigel matrix and the membrane of the top well in a Transwell chamber are shown. Left: Cells in response to 5 µM resveratrol (Res) on the bottom well. Right: Cells in response to 50 µM resveratrol (Res) on the bottom well.
Figure 2
Figure 2
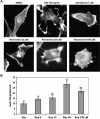
Reorganization of the actin cytoskeleton in response to resveratrol. (A) Quiescent MDA-MB-231 cells were treated with vehicle (DMSO), EGF (50 ng/ml), estrogen (0.1 µM; top panel), or resveratrol at 5, 50, or 100 µM (bottom panel) for 10 minutes, then fixed and stained for F-actin. Results shown are representative of at least 100 cells/treatment (original magnification, x600). Arrowheads indicate filopodia; arrows indicate lamellipodia. (B) The mean filopodia number per cell was quantified from at least 50 cells/treatment in response to vehicle (Veh) or various concentrations of resveratrol (Res). Treatments denoted by the same letter indicate no significant difference between those treatments. Treatments denoted by different letters indicate a significant difference between those treatments at P < .05. (C and D) Cytoskeletal structures in response to 5 or 50 µM resveratrol as a function of time. Quiescent MDA-MB-231 cells were treated with DMSO vehicle (Veh) or 5 or 50 µM resveratrol (Res), then fixed and stained for F-actin at various times following treatment. (C) Number of filopodia per cell. (D) Number of lamellipodia per cell.
Figure 2
Figure 2
Reorganization of the actin cytoskeleton in response to resveratrol. (A) Quiescent MDA-MB-231 cells were treated with vehicle (DMSO), EGF (50 ng/ml), estrogen (0.1 µM; top panel), or resveratrol at 5, 50, or 100 µM (bottom panel) for 10 minutes, then fixed and stained for F-actin. Results shown are representative of at least 100 cells/treatment (original magnification, x600). Arrowheads indicate filopodia; arrows indicate lamellipodia. (B) The mean filopodia number per cell was quantified from at least 50 cells/treatment in response to vehicle (Veh) or various concentrations of resveratrol (Res). Treatments denoted by the same letter indicate no significant difference between those treatments. Treatments denoted by different letters indicate a significant difference between those treatments at P < .05. (C and D) Cytoskeletal structures in response to 5 or 50 µM resveratrol as a function of time. Quiescent MDA-MB-231 cells were treated with DMSO vehicle (Veh) or 5 or 50 µM resveratrol (Res), then fixed and stained for F-actin at various times following treatment. (C) Number of filopodia per cell. (D) Number of lamellipodia per cell.
Figure 3
Figure 3
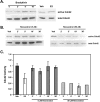
Cdc42 activity of MDA-MB-231 cells in response to estrogen or resveratrol. Quiescent cells were lysed immediately after treatment with compounds for the indicated times, and WASP-PBD-GST beads were used to pull down active GTP-bound Cdc42. Active and total Cdc42 levels were detected by Western blot analysis with anti-Cdc42 antibody. (A) Quiescent MDA-MB-231 cells were treated for 10 minutes with DMSO (0) or for 2, 5, or 10 minutes with 400 ng/ml bradykinin or 0.1 µM estrogen (E2) and used for pull-down assays to determine endogenous Cdc42 activity. Representative Western blot analyses of active and total Cdc42 are shown. (B) Cells were treated with DMSO (Veh) or resveratrol at 5 or 50 µM for 2, 5, 10, or 30 minutes. Cells were lysed immediately and used for pull-down assays to determine endogenous Cdc42 activity. Representative Western blot analyses of active and total Cdc42 levels from three separate experiments are shown. (C) Cdc42 activity (active Cdc42/total Cdc42) relative to vehicle (Veh) as quantified from densitometric scans of Western blot analyses. *Statistical significance from control at P ≤ .05. Error bars represent SEMs from at least three experiments. n = 2 for 2, 5, or 30 minutes, and n = 6 for 10 minutes in treatments with 50 µM resveratrol.
Figure 4
Figure 4
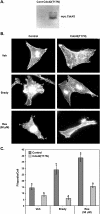
Effect of a stable expression of a dominant-negative Cdc42(T17N) on resveratrol-mediated filopodia extension. (A) Representative Western blot analysis of MDA-MB-231 cells stably expressing vector or myc-tagged Cdc42. (B) Filopodia extension in response to resveratrol in cells expressing vector alone or Cdc42(T17N). Quiescent MDA-MB-231 cells expressing a control vector (control) or myc-tagged Cdc42(T17N) were treated with vehicle (Veh), 400 ng/ml bradykinin (Brady), or 50 µM resveratrol (Res), then fixed and stained for F-actin with rhodamine phalloidin. Representative cells of at least 100 cells/treatment are shown. Arrowheads indicate filopodia. (C) Quantification of the effect of the stable expression of a dominant-negative Cdc42(T17N) on resveratrol-mediated filopodia extension. Quiescent MDA-MB-231 cells expressing a control vector (dark-grey columns) or Cdc42(T17N) (light-grey columns) were treated with vehicle, 400 ng/ml bradykinin, or 50 µM resveratrol, then fixed and stained for F-actin with rhodamine phalloidin. The relative number of filopodia per cell (± SEM) was quantified from micrographs for at least 100 cells/treatment. Treatments denoted by the same letter indicate no significant difference between those treatments. Treatments denoted by different letters indicate a significant difference between those treatments at P ≤ .05.
Figure 5
Figure 5
Rac activity of breast cancer cells in response to estrogen or resveratrol. Quiescent MDA-MB-231 cells were treated with DMSO (Veh), 50 ng/ml EGF, 0.1 µM estrogen (E2), or resveratrol (Res). PAK-PBD-GST beads were used to pull down active GTP-bound Rac from cell lysates. Active and total Rac levels were detected by Western blot analysis with anti-Rac antibody. (A) Representative Western blot analysis of the Rac activity of MDA-MB-231 cells in response to vehicle, EGF, E2, or resveratrol at 5 or 50 µM following a 10-minute incubation. Results shown are representative of at least three experiments. (B) Rac activity (active Rac/total Rac) relative to vehicle-alone control as quantified from densitometric scans of Western blot analyses. *Statistical significance from control. Error bars represent SEMs from at least three experiments. n = 2 for 30 or 60 minutes in 5 µM resveratrol, and n = 2 for 5, 20, 30, or 60 minutes in 50 µM resveratrol.
Figure 6
Figure 6
Effect of a stable expression of a dominant-negative Rac on estrogen-mediated actin structures. (A) Representative Western blot analysis of MDA-MB-231 cells stably expressing vector (control) or myc-tagged Rac. (B) Actin structures in response to resveratrol in cells expressing Rac1(T17N). Quiescent MDA-MB-231 cells expressing vector (control) or myc-tagged Rac1(T17N) were treated with vehicle (UN), 50 ng/ml EGF, 0.1 µM estrogen (E2), 5 or 50 µM resveratrol (Res), then fixed and stained for F-actin with rhodamine phalloidin. Representative cells of at least 100 cells/treatment are shown. Arrows indicate lamellipodia; arrowheads indicate filopodia. (C and D) Quiescent MDA-MB-231 cells expressing a control vector (dark-grey columns) or Rac1(T17N) (light-grey columns) were treated with vehicle (Veh), 50 ng/ml EGF, 0.1 µM estrogen (E2), or 5 or 50 µM resveratrol (Res), then fixed and stained for F-actin with rhodamine phalloidin. The relative number of lamellipodia per cell (± SEM) quantified from micrographs for at least 100 cells/treatment (C). The relative number of filopodia per cell (± SEM) quantified from micrographs for at least 100 cells/treatment (D). Treatments denoted by the same letter indicate no significant difference between those treatments. Treatments denoted by different letters indicate a significant difference between those treatments at P ≤ .05.
Figure 6
Figure 6
Effect of a stable expression of a dominant-negative Rac on estrogen-mediated actin structures. (A) Representative Western blot analysis of MDA-MB-231 cells stably expressing vector (control) or myc-tagged Rac. (B) Actin structures in response to resveratrol in cells expressing Rac1(T17N). Quiescent MDA-MB-231 cells expressing vector (control) or myc-tagged Rac1(T17N) were treated with vehicle (UN), 50 ng/ml EGF, 0.1 µM estrogen (E2), 5 or 50 µM resveratrol (Res), then fixed and stained for F-actin with rhodamine phalloidin. Representative cells of at least 100 cells/treatment are shown. Arrows indicate lamellipodia; arrowheads indicate filopodia. (C and D) Quiescent MDA-MB-231 cells expressing a control vector (dark-grey columns) or Rac1(T17N) (light-grey columns) were treated with vehicle (Veh), 50 ng/ml EGF, 0.1 µM estrogen (E2), or 5 or 50 µM resveratrol (Res), then fixed and stained for F-actin with rhodamine phalloidin. The relative number of lamellipodia per cell (± SEM) quantified from micrographs for at least 100 cells/treatment (C). The relative number of filopodia per cell (± SEM) quantified from micrographs for at least 100 cells/treatment (D). Treatments denoted by the same letter indicate no significant difference between those treatments. Treatments denoted by different letters indicate a significant difference between those treatments at P ≤ .05.

Similar articles

Cited by

References

    1. Levin ER. Integration of the extranuclear and nuclear actions of estrogen. Mol Endocrinol. 2005;19:1951–1959. - PMC - PubMed
    1. Azios NG, Dharmawardhane SF. Resveratrol and estradiol exert disparate effects on cell migration, cell surface actin structures, and focal adhesion assembly in MDA-MB-231 human breast cancer cells. Neoplasia. 2005;7:128–140. - PMC - PubMed
    1. Acconcia F, Barnes CJ, Kumar R. Estrogen and tamoxifen induce cytoskeletal remodeling and migration in endometrial cancer cells. Endocrinology. 2006;147:1203–1212. - PubMed
    1. Song RX, Santen RJ. Membrane initiated estrogen signaling in breast cancer. Biol Reprod. 2006;75:9–16. - PubMed
    1. Simoncini T, Scorticati C, Mannella P, Fadiel A, Giretti MS, Fu XD, Baldacci C, Garibaldi S, Caruso A, Fornari L, et al. Estrogen receptor {alpha} interacts with G{alpha}13 to drive actin remodeling and endothelial cell migration via the RhoA/Rho kinase/moesin pathway. Mol Endocrinol. 2006;20:1756–1771. - PubMed

Publication types

MeSH terms