. 2007 Feb;9(2):166-80.
doi: 10.1593/neo.07112.

Oncomine 3.0: genes, pathways, and networks in a collection of 18,000 cancer gene expression profiles

Affiliations

Oncomine 3.0: genes, pathways, and networks in a collection of 18,000 cancer gene expression profiles

Daniel R Rhodes et al. Neoplasia. 2007 Feb.

Abstract

DNA microarrays have been widely applied to cancer transcriptome analysis; however, the majority of such data are not easily accessible or comparable. Furthermore, several important analytic approaches have been applied to microarray analysis; however, their application is often limited. To overcome these limitations, we have developed Oncomine, a bioinformatics initiative aimed at collecting, standardizing, analyzing, and delivering cancer transcriptome data to the biomedical research community. Our analysis has identified the genes, pathways, and networks deregulated across 18,000 cancer gene expression microarrays, spanning the majority of cancer types and subtypes. Here, we provide an update on the initiative, describe the database and analysis modules, and highlight several notable observations. Results from this comprehensive analysis are available at http://www.oncomine.org.


Figures

Figure 1
Figure 1
Oncomine consists of three layers: data input, data analysis, and data visualization, with the Oncomine database playing a central role. The data input layer has two components: the microarray data pipeline and the annotation data warehouse. The microarray pipeline is used internally to identify and prioritize microarray studies in the literature. The pipeline also draws data directly from the Stanford Microarray Database and the NCBI Gene Expression Omnibus. The annotation warehouse represents our live compilation of > 10 external databases that were deemed useful for interpreting a gene's role in cancer. The Oncomine database is an Oracle 9i relational database. The data analysis layer consists of sample facts standardization and automated statistical analysis. Sample facts standardization uses the NCI Thesaurus and manual annotation. The automated statistical analysis component is implemented in Perl and R. A series of scripts monitors the database for new data and sample parameters and automatically performs differential expression analysis, cluster analysis, and gene set analysis, when needed. Oncomine web servers query data from the Oncomine database and display tabular and graphical representations of data and analysis results. The web layer is implemented in Java/JSP and creates dynamic SVG.
Figure 2
Figure 2
Selected expression profiles of Gleevec targets: ABL1, KIT, and PDGFRa. (A) Among 71 molecular alteration analyses, ABL1 was most significantly overexpressed in leukemias with BCR-ABL translocations relative to leukemias with other translocations. (B) Among 67 cancer-type analyses, KIT was most significantly overexpressed in GISTs relative to other soft-tissue tumors. KIT was also found to be significantly overexpressed in multiple myeloma (MM) relative to normal B cells, and in seminoma relative to normal testes. (C) PDGFRα was significantly overexpressed in PDGFRα mutant GISTs relative to KIT mutant GISTs, suggesting that activating mutations are associated with overexpression. In two independent data sets, PDGFRα is overexpressed in primary tumors relative to cultured tumor cells, highlighting the importance of PDGFRα in tumor-host interactions. Finally, PDGFRa shows overexpression in soft-tissue sarcomas relative to melanomas. (D) Across a panel of sarcomas, PDGFRα shows overexpression in a fraction of the GISTs and in all synovial sarcomas, but not in clear cell sarcoma, liposarcoma, or leiomyosarcoma. Moderate expression was observed in fibrosarcomas and malignant fibrous histiocytoma (MFH). The number of samples is provided in parenthesis, and data sets are named by author and tissue. The y-axis units are based on z-score normalization.
Figure 3
Figure 3
Therapeutics targets overexpressed in prostate cancer progression. (A) Twenty of 337 genes that encode known therapeutic targets that are mostly overexpressed in the progression from benign prostate (BPH = benign prostatic hyperplasia; NAP = normal adjacent prostate) to localized prostate cancer (PCa) to metastatic prostate cancer. (B) PRKCZ, the most overexpressed drug target in metastatic prostate cancer, has also been significantly overexpressed in prostate cancer in two independent data sets PRKCZ is targeted by bisindolylmaleimide I, and its inhibition has been shown to arrest growth in glioblastoma cells [20]. (C) SHMT2 is another drug target that is overexpressed in prostate cancer progression. The expression pattern is validated by an analogous data set SHMT2 is a mitochondrial serine hydroxymethyltransferase that is specifically inhibited by the plant amino acid mimosine [21].
Figure 4
Figure 4
ERBB2 cluster in invasive breast carcinoma. (A) ERBB2 is coexpressed (R = 0.56) with 14 genes across a panel of 295 breast carcinoma samples (101 cases that went on to metastasize are shown). All 14 genes are located near ERBB2 on chromosome 17q, suggesting that coexpression can be attributed to known amplification of this region in breast carcinoma. (B) GRB7 is immediately adjacent to ERBB2 and displays a nearly identical expression pattern (R = 0.91) across the breast carcinoma samples, indicating that GRB7 is coexpressed and likely coamplified with ERBB2 in all cases.
Figure 5
Figure 5
COPA indicates that ERBB2 and ERG exhibit outlier expression in multiple breast and prostate cancer microarray data sets, respectively. (A) ERBB2 expression profile in the Perou et al. [31] cDNA microarray data set. (B) ERBB2 expression profile in the van de Vijver et al. [32] oligonucleotide data set, segregated by estrogen receptor (ER) status. (C) ERG expression profile in a cDNA microarray data set. (D) ERG expression profile in an oligonucleotide data set, segregated by Gleason score.
Figure 6
Figure 6
Analyzing cancer signatures in the context of related gene sets can identify coordinately regulated functional modules. To test for the enrichment of related gene sets in cancer signatures, the overlap is assessed as a 2 x 2 contingency table, and then a Fisher's exact test is performed. Related gene set analysis is automatically performed for a wide variety of gene sets across hundreds of cancer signatures from the Oncomine database.
Figure 7
Figure 7
Molecular concepts analysis of cancer signatures. Oncomine analyzes 13 types of molecular concepts (Table 4) and searches for significant enrichment in cancer and normal tissue signatures. Signatures were computed for each cancer type in the Su et al. multicancer data set [25], and representative enriched molecular concepts are presented. Each row in the heatmap represents a gene in the labeled molecular concept. Red indicates relative overexpression, and blue indicates relative underexpression. Fatty acid metabolism genes were enriched in the prostate cancer signature; protein metabolism genes were enriched in the colorectal cancer signature; immunoglobulin-like genes were enriched in the renal cell carcinoma signature; and proteolysis gene were enriched in the pancreatic cancer signature.
Figure 8
Figure 8
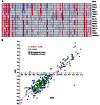
Protein interaction networks overexpressed in multiple myeloma. (A) Heatmaps depicting the overexpression of the RAF1 and IARS networks in multiple myeloma relative to normal B cells. Seven of 42 interactions partners of RAF1 are in the top 5% of the myeloma profile (OR = 4.35, P = .004), and 9 of 10 interaction partners of IARS are in the top 20% of the myeloma profile (OR = 21.58, P = 2.6e - 6). (B) The extended RAF1 network overexpressed in multiple myeloma displaying the multifaceted activation of RAF1. (C) The IARS network overexpressed in multiple myeloma.

References

    1. Chung CH, Bernard PS, Perou CM. Molecular portraits and the family tree of cancer. Nat Genet. 2002;32:533–540. - PubMed
    1. Parkinson H, Sarkans U, Shojatalab M, Abeygunawardena N, Contrino S, Coulson R, Farne A, Lara GG, Holloway E, Kapushesky M, et al. ArrayExpress—a public repository for microarray gene expression data at the EBI. Nucleic Acids Res. 2005;33:D553–D555. - PMC - PubMed
    1. Barrett T, Suzek TO, Troup DB, Wilhite SE, Ngau WC, Ledoux P, Rudnev D, Lash AE, Fujibuchi W, Edgar R. NCBI GEO: mining millions of expression profiles—database and tools. Nucleic Acids Res. 2005;33:D562–D566. - PMC - PubMed
    1. Rhodes DR, Yu J, Shanker K, Deshpande N, Varambally R, Ghosh D, Barrette T, Pandey A, Chinnaiyan AM. ONCOMINE: a cancer microarray database and integrated data-mining platform. Neoplasia. 2004;6:1–6. - PMC - PubMed
    1. Rhodes DR, Yu J, Shanker K, Deshpande N, Varambally R, Ghosh D, Barrette T, Pandey A, Chinnaiyan AM. Large-scale metaanalysis of cancer microarray data identifies common transcriptional profiles of neoplastic transformation and progression. Proc Natl Acad Sci USA. 2004;101:9309–9314. (Epub 2004 June 9307) - PMC - PubMed

Publication types

MeSH terms

LinkOut - more resources