. 2007 Apr 15;195(8):1097-107.
doi: 10.1086/512162. Epub 2007 Mar 5.

Patterns of host genome-wide gene transcript abundance in the peripheral blood of patients with acute dengue hemorrhagic fever

Affiliations

Patterns of host genome-wide gene transcript abundance in the peripheral blood of patients with acute dengue hemorrhagic fever

Cameron P Simmons et al. J Infect Dis. .

Abstract

Responses by peripheral blood leukocytes may contribute to the pathogenesis of dengue hemorrhagic fever (DHF). We used DNA microarrays to reveal transcriptional patterns in the blood of 14 adults with DHF. Acute DHF was defined by an abundance of transcripts from cell cycle- and endoplasmic reticulum (ER)-related genes, suggesting a proliferative response accompanied by ER stress. Transcript-abundance levels for immunoresponse-associated genes, including cell surface markers, immunoglobulin, and innate response elements, were also elevated. Twenty-four genes were identified for which transcript abundance distinguished patients with dengue shock syndrome (DSS) from those without DSS. All the gene transcripts associated with DSS, many of which are induced by type I interferons, were less abundant in patients with DSS than in those without DSS. To our knowledge, these data provide the first snapshot of gene-expression patterns in peripheral blood during acute dengue and suggest that DSS is associated with attenuation of selected aspects of the innate host response.


Conflict of interest statement

Potential conflicts of interest: none reported.

Figures

Figure 1.
Figure 1.
Unsupervised hierarchical clustering of 34 whole blood RNA samples from 14 patients with dengue and 4 healthy donors. Each row represents the relative level of expression for a single gene; each column shows the expression level for a single sample. The red and green colors indicate high and low expression, respectively. Samples collected from patients with dengue on study day 1 are shown in blue, samples collected after day 1 are shown in purple, and samples from healthy donors are shown in black. The blue horizontal bar indicates 10 early samples with similar gene expression patterns, and gene clusters associated with segregation of these samples are displayed in blue. Sample nos. are as shown in table 2, reported day of illness at the time of sampling is preceded by a “d,” and asterisks identify those patients who received a diagnosis of dengue shock syndrome on study day 1.
Figure 2.
Figure 2.
Reclustering of samples from figure 1 using the genes associated with the “early sample” cluster in figure 1. Colors are as in figure 1. Gene ontology terms overrepresented in the cluster of genes expressed at higher levels in the early samples are represented by the associated genes, and Unigene symbols are used to indicate each gene (available at: http://www.ncbi.nlm.nih.gov/entrez/query.fcgi?dbpunigene). Genes whose products are associated with the endoplasmic reticulum are in italics, and genes whose products are associated with the mitotic cell cycle are in bold. Sample nos. are as shown in table 2, reported day of illness at time of sampling is preceded by a “d,” and asterisks identify those patients who received a diagnosis of dengue shock syndrome on study day 1.
Figure 3.
Figure 3.
Association of clinical and laboratory parameters with gene expression. For panel A, sample nos. and genes are as shown in figure 1. The gray column on the right highlights genes (red) that were identified as being associated with shock at presentation. Vertical blue bars mark the same gene clusters as in figure 2. For panel B, Pearson correlation coefficients were used to determine the significance and direction of association of each gene's expression pattern with a given clinical or laboratory parameter (see Patients and Methods); the resulting log-transformed P values are plotted as a moving average, with a window size of 15. Stronger associations are placed farther from the axis, and whether the correlation was positive (+) or negative (−) is indicated. The dotted line corresponds to P < .01 . Asterisks mark associations of gene expression with a given parameter (see Results).
Figure 4.
Figure 4.
Flow cytometry results derived from staining whole blood collected from a child with dengue shock syndrome (DSS; day 5 of illness). CD19+ B cells, which comprised 2 populations distinguished by granularity (A), were gated, and the percentage of CD138+CD38+ B cells among the CD19+ population was determined (B). Virtually all CD19+CD138+ B cells expressed the nuclear-associated antigen Ki-67, indicating they were in cell cycle (C; isotype control [D], anti—Ki-67). FITC, fluorescein isothiocyanate; PE, phycoerythrim.
Figure 5.
Figure 5.
Oligoadenylate synthetase 3 and cathepsin L mRNA levels in patients with and without shock. The figure and legend (which includes a description of the methods) are available in their entirety in the online edition of the Journal of Infectious Diseases.
Table 1.
Table 1.
Primers, probes, and polymerase chain reaciton conditions for the detection of dengue viruses.
Table 2.
Table 2.
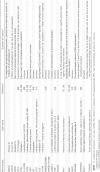
Clinical summary of patients with secondary dengue (DEN) infections.
Table 3.
Table 3.
Genes with transcript abundance that correlates with CD4+:CD8+ lymphocyte ratio.
Table 4.
Table 4.
CD138+CD38+ plasmablasts/plasma cells as a percentage of CD19+CD20 B cells in peripheral blood of control subjects and in children (mean age, 11 years) with acute secondary dengue at hospital admission and discharge.
Table 5.
Table 5.
Genes associated with dengue shock syndrome in Vietnamese adults.

References

    1. Rothman AL. Dengue: defining protective versus pathologic immunity. J Clin Invest. 2004;113:946–51. - PMC - PubMed
    1. Libraty DH, Endy TP, Houng HS, et al. Differing influences of virus burden and immune activation on disease severity in secondary dengue-3 virus infections. J Infect Dis. 2002;185:1213–21. - PubMed
    1. Vaughn DW, Green S, Kalayanarooj S, et al. Dengue viremia titer, antibody response pattern, and virus serotype correlate with disease severity. J Infect Dis. 2000;181:2–9. - PubMed
    1. Green S, Vaughn DW, Kalayanarooj S, et al. Early immune activation in acute dengue illness is related to development of plasma leakage and disease severity. J Infect Dis. 1999;179:755–62. - PubMed
    1. Juffrie M, Meer GM, Hack CE, et al. Inflammatory mediators in dengue virus infection in children: interleukin-6 and its relation to C-reactive protein and secretory phospholipase A2. Am J Trop Med Hyg. 2001;65:70–5. - PubMed

Publication types

MeSH terms