. 2007 Apr;80(4):605-15.
doi: 10.1086/512821. Epub 2007 Feb 16.

Overcoming the winner's curse: estimating penetrance parameters from case-control data

Affiliations

Overcoming the winner's curse: estimating penetrance parameters from case-control data

Sebastian Zollner et al. Am J Hum Genet. 2007 Apr.

Abstract

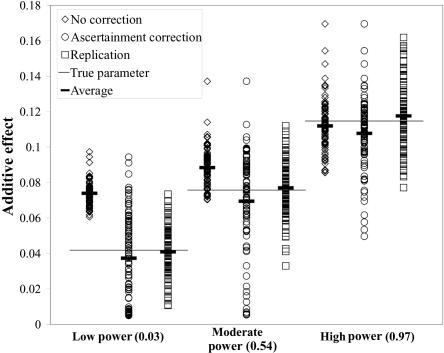
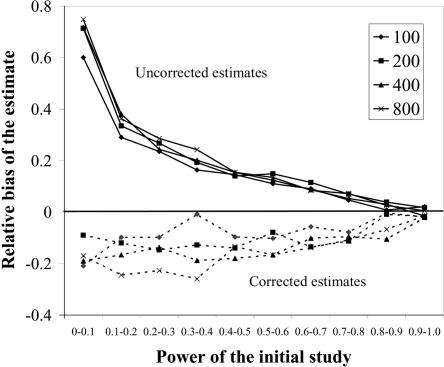
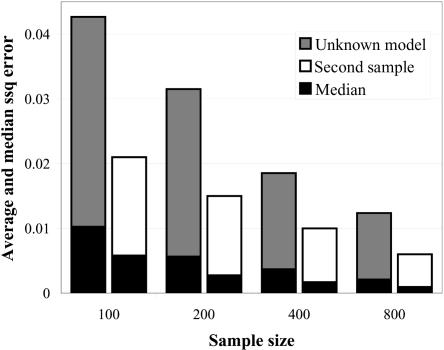
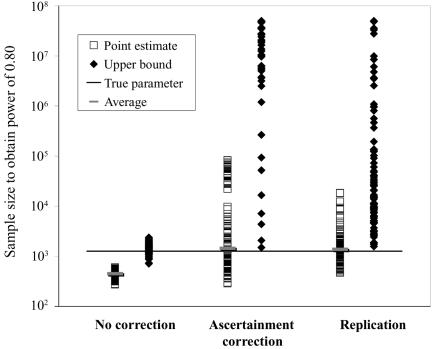
Genomewide association studies are now a widely used approach in the search for loci that affect complex traits. After detection of significant association, estimates of penetrance and allele-frequency parameters for the associated variant indicate the importance of that variant and facilitate the planning of replication studies. However, when these estimates are based on the original data used to detect the variant, the results are affected by an ascertainment bias known as the "winner's curse." The actual genetic effect is typically smaller than its estimate. This overestimation of the genetic effect may cause replication studies to fail because the necessary sample size is underestimated. Here, we present an approach that corrects for the ascertainment bias and generates an estimate of the frequency of a variant and its penetrance parameters. The method produces a point estimate and confidence region for the parameter estimates. We study the performance of this method using simulated data sets and show that it is possible to greatly reduce the bias in the parameter estimates, even when the original association study had low power. The uncertainty of the estimate decreases with increasing sample size, independent of the power of the original test for association. Finally, we show that application of the method to case-control data can improve the design of replication studies considerably.


Figures

Figure  1.
Figure 1.
Estimates of the genetic effect generated for three parameter sets with low, intermediate, and high power. For each parameter set, 100 significant association studies were generated, and the underlying parameters were estimated by three different methods: (1) not correcting for ascertainment (diamonds), (2) correcting for ascertainment (circles), and (3) collecting a second unascertained sample and basing the estimate on that sample (squares). The vertical axis shows the estimated genetic effect; the horizontal axis groups the estimates by the power of the initial study. The horizontal line in each power category indicates the true underlying genetic effect, and the short horizontal bar indicates the average of each distribution of 100 data sets.
Figure  2.
Figure 2.
Bias of the uncorrected and corrected estimates of the additive genetic effect. For each of the sample sizes, the data set has been stratified into 10 categories of power indicated on the horizontal axis. The vertical axis indicates the average relative bias observed in each power category. We performed simulations with four sample sizes, as indicated by the legend. The solid lines show the bias of estimates of penetrance parameters that were generated without correction for ascertainment, whereas the dashed lines show the bias of estimates generated while correcting for ascertainment.
Figure  3.
Figure 3.
Accuracy of point estimates for penetrance parameters dependent on sample size (horizontal axis). All estimates were corrected for ascertainment. The height of each bar indicates the average difference between the true and inferred parameters measured as ssq (see the “Methods” section), and the black portion of the bar displays the median ssq statistic. The dark gray bars show the ssq error of estimates generated without conditioning on a genetic model. The white bars show the ssq error of an estimate generated from an unascertained sample of the same size without knowing the underlying model.
Figure  4.
Figure 4.
Estimated sample size for a replication study. We used the 100 parameter estimates for the low-powered study described in figure 1 to calculate the sample size required to achieve 0.80 power for α=10-6 in a replication study. The vertical axis indicates the calculated sample size, and the horizontal axis shows the method used to estimate the sample size; the squares represent results based on point estimates; the diamonds show results based on upper 95% bounds. The horizontal line shows the actual required sample size (1,261), and the short horizontal bars display the average of each set of point estimates.

References

Web Resource

    1. S.Z.'s Web site, http://www.sph.umich.edu/csg/zollner (for supplementary material containing results for additional genetic models, the size of the 95% confidence region for different sample sizes, and results for misspecified disease prevalence)

References

    1. Hirschhorn JN, Lohmueller K, Byrne E, Hirschhorn K (2002) A comprehensive review of genetic association studies. Genet Med 4:45–61 - PubMed
    1. Lohmueller KE, Pearce CL, Pike M, Lander ES, Hirschhorn JN (2003) Meta-analysis of genetic association studies supports a contribution of common variants to susceptibility to common disease. Nat Genet 33:177–18210.1038/ng1071 - DOI - PubMed
    1. Herbert A, Gerry NP, McQueen MB, Heid IM, Pfeufer A, Illig T, Wichmann HE, Meitinger T, Hunter D, Hu FB, et al (2006) A common genetic variant is associated with adult and childhood obesity. Science 312:279–28310.1126/science.1124779 - DOI - PubMed
    1. Edwards AO, Ritter R, Abel JK, Manning A, Panhuysen C, Farrer LA (2005) Complement factor H polymorphism and age-related macular degeneration. Science 308:421–42410.1126/science.1110189 - DOI - PubMed
    1. Capen EC, Clapp RV, Campbell WM (1971) Competitive bidding in high-risk situations. J Petrol Technol 23:641–653

Publication types

LinkOut - more resources