Clinical Trial
. 2007 Jun;100(3):309-20.
doi: 10.1007/s00421-007-0425-8. Epub 2007 Mar 15.

Conventionally assessed voluntary activation does not represent relative voluntary torque production

Affiliations
Clinical Trial

Conventionally assessed voluntary activation does not represent relative voluntary torque production

R D Kooistra et al. Eur J Appl Physiol. 2007 Jun.

Abstract

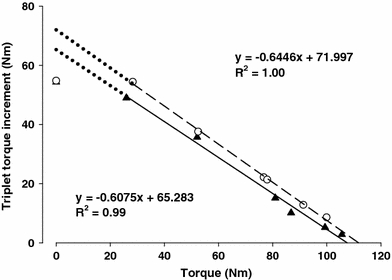
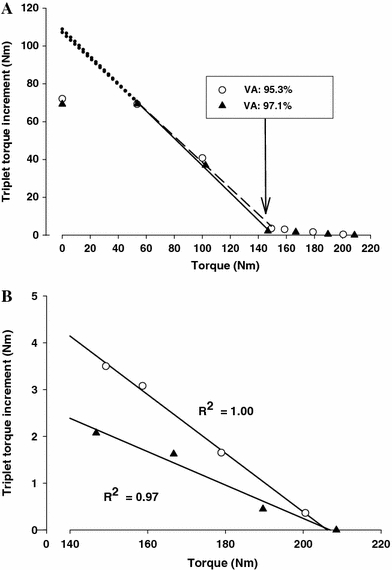
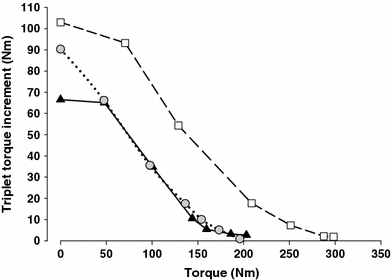
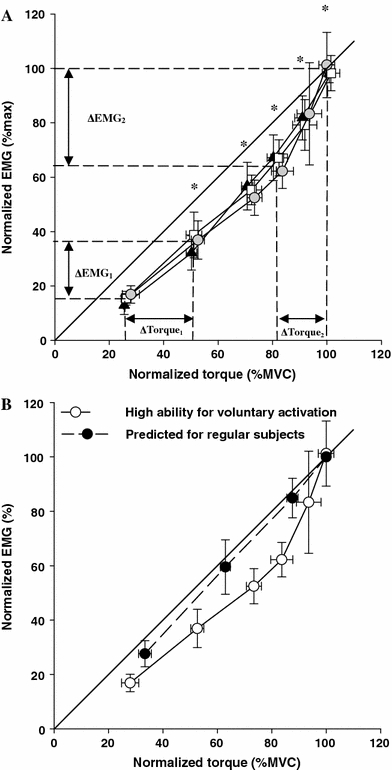
The ability to voluntarily activate a muscle is commonly assessed by some variant of the twitch interpolation technique (ITT), which assumes that the stimulated force increment decreases linearly as voluntary force increases. In the present study, subjects (n = 7) with exceptional ability for maximal voluntary activation (VA) of the knee extensors were used to study the relationship between superimposed and voluntary torque. This includes very high contraction intensities (90-100%VA), which are difficult to consistently obtain in regular healthy subjects (VA of approximately 90%). Subjects were tested at 30, 60, and 90 degrees knee angles on two experimental days. At each angle, isometric knee extensions were performed with supramaximal superimposed nerve stimulation (triplet: three pulses at 300 Hz). Surface EMG signals were obtained from rectus femoris, vastus lateralis, and medialis muscles. Maximal VA was similar and very high across knee angles: 97 +/- 2.3% (mean +/- SD). At high contraction intensities, the increase in voluntary torque was far greater than would be expected based on the decrement of superimposed torque. When voluntary torque increased from 79.6 +/- 6.1 to 100%MVC, superimposed torque decreased from 8.5 +/- 2.6 to 2.8 +/- 2.3% of resting triplet. Therefore, an increase in VA of 5.7% (from 91.5 +/- 2.6 to 97 +/- 2.3%) coincided with a much larger increase in voluntary torque (20.4 +/- 6.1%MVC) and EMG (33.9 +/- 6.6%max). Moreover, a conventionally assessed VA of 91.5 +/- 2.6% represented a voluntary torque of only 79.6 +/- 6.1%MVC. In conclusion, when maximal VA is calculated to be approximately 90% (as in regular healthy subjects), this probably represents a considerable overestimation of the subjects' ability to maximally drive their quadriceps muscles.


Figures

Fig. 1
Fig. 1
Typical example of a superimposed contraction. The resting triplet torque as a result of the electrical stimulation as well as the triplet torque increment on a 100%MVC contraction at the 90° knee angle are shown. The timing of the triplet stimulation is shown by the vertical arrows and vertical dashed lines. Voluntary activation (VA) is generally calculated using the following equation: VA (%) = 100–[(triplet torque increment/resting triplet torque) × 100]. In this particular example, voluntary activation was calculated to be: 100–[(4.2/94.6) × 100] = 95.6%
Fig. 2
Fig. 2
Torque increment as result of the triplet versus voluntary torque delivered at the 30° knee angle by a normal healthy subject in a pilot study. The empty circles denote the first day of testing, and the black triangles the second day. The dashed and solid lines represent linear regression fits for the data points on experimental days 1 and 2, respectively, excluding the resting triplet torque at 0 Nm. The resting triplet torque is clearly underestimated as it is very similar to the triplet torque increment at ∼30 Nm. The dotted lines represent backward extrapolation of the regression fits for both experimental days and illustrate the underestimation of the resting triplet torque as a result of tendon slack. For each experimental day, the respective equations and R2 values are shown. Using the interpolated twitch torque technique, voluntary activation (VA) is calculated to be quite high for experimental days 1 (84.4%) and 2 (94.7%)
Fig. 3
Fig. 3
a The torque increment as a result of the triplet on a voluntary contraction (y-axis) is shown as a function of the voluntarily delivered torque just before the triplet (x-axis). The data points shown are those of subject no. 1, a subject with high ability for maximal voluntary activation, at the 30° knee angle. The open circles denote results from experimental day 1 and the filled triangles from experimental day 2. It is immediately apparent that using a linear or a curvilinear fit over all data points is incorrect for this subject. The dashed and solid lines illustrate linear regression fits that have been performed for a voluntary torque level of ∼50–150 Nm for experimental days 1 and 2, respectively. The dotted lines represent backward extrapolation of the regression fits for both experimental days and illustrate the potential effect of tendon slack on the resting triplet torque, especially when compared to the triplet torque increment at ∼60 Nm. For clarity, and to illustrate the continued decrease of the triplet torque increment with increasing voluntary torque, the data points of torque levels above 140 Nm have been replotted in Fig. 3b. b Data points from Fig. 3A have been replotted for torque levels above 140 Nm. The torque increment as a result of the triplet is shown as a function of the voluntarily delivered torque just before the triplet (x-axis) for four high intensity contractions (70, 80, 90, and 100%MVC). The open circles represent data points obtained on experimental day 1 and the filled triangles experimental day 2. A linear regression line shows the continued decrease in triplet torque increment with increase in contraction intensity for each set of four data points with corresponding R2 values
Fig. 4
Fig. 4
The torque increment as result of the triplet is shown as a function of voluntary torque for subject no. 5 on experimental day 1. Note that at the higher contraction intensities (>70%), the shape of the curve is similar at the 30° (black triangles, solid line), 60° (white squares, dashed line), and 90° (grey circles, dotted line) knee angle at the higher (>70%MVC) contraction intensities
Fig. 5
Fig. 5
Average (2 days) maximal voluntary activation (VA) per subject for the 30° (black triangles), 60° (white squares), and 90° (grey circles) knee angles. Note that only 2 out of a total of 21 data points are below 95%VA. The horizontal dotted line indicates the 90%VA level that is generally obtained for the knee extensors by regular healthy subjects
Fig. 6
Fig. 6
The torque increment as result of the triplet is shown as a function of voluntary torque for subject no. 1 (grey squares) and 7 (open circles) at the 60° knee angle on day 1. At the 60° knee angle, the maximal VA level of subject no. 7 calculated at 250 Nm was 90.7%, which resembled that of a regular subject, and is exceptionally low in our study (see lowest point in Fig. 5). A VA of 90.0% is also calculated at 240 Nm for subject no. 1. In both subjects, this implies a further potential increase in torque of 10%, yet a >30% torque increase (to 330 Nm) could be demonstrated in subject 1. This is most likely due to the exceptional neural drive of subject 1 (∼98%VA) during his best attempts at this knee angle
Fig. 7
Fig. 7
a Normalized rsEMG levels averaged over the two experimental days versus normalized torque for the vastus lateralis (VL) muscle at 30° (black triangles), 60° (white squares), and 90° (grey circles) knee angles. *Significantly different (P < 0.05) from preceding intensity level. At the lower contraction intensities, ΔEMG1 denotes the increase in EMG (21%, across muscles) that is accompanied by a comparatively larger increase torque (∼25%), which is denoted by ΔTorque1. Conversely, ΔEMG2 denotes the much larger increase in EMG (∼34%, across muscles) that is accompanied by a comparatively smaller increase in normalized torque (∼18%, denoted by ΔTorque2) as the contraction intensity approaches MVC. Note that on average for ΔTorque2, calculated voluntary activation (VA) increased from 91.5 ± 2.6% to 97.2 ± 2.3%. Thus, a 34% increase in normalized rsEMG was accompanied by an 18% increase in torque, for which only a ∼5.7% increase in VA (denoted by ΔVA) was calculated. As a consequence of the relatively large increase in EMG as MVC is approached, the rsEMG of contraction intensities below MVC are normalized to a relatively large value and are located well beneath the line of identity. b Normalized rsEMG levels averaged over days versus normalized torque for the vastus lateralis (VL) muscle at the 90° knee angle. The white circles represent rsEMG values that have been normalized to the MVC of subjects with a very high ability for voluntary activation (VA). With the black circles, the EMG–torque relationship for regular healthy subjects has been predicted. The black circles denote rsEMG values that have been renormalized to the rsEMG value reached at 90%VA. This is similar to the usual maximal VA in regular individuals. Note that the EMG–torque relationship predicted for regular healthy subjects is linear and closer to the line of identity compared to subjects with very high ability for voluntary activation
Fig. 8
Fig. 8
Representative EMG recordings are shown for the vastus lateralis (VL, upper panel) and biceps femoris (BF, lower panel) muscle. On the left, the M-wave for the VL as a result of supramaximal twitch stimulation applied to the n. femoralis. The simultaneous EMG recording for the BF muscle is shown in the lower left panel. On the right, the EMG recording during maximal voluntary extension (top, right) and flexion (lower, right) torque is shown to illustrate that the lower M-wave of the BF is not due a lower sensitivity of the BF recordings compared to the VL recordings

References

    1. {'text': '', 'ref_index': 1, 'ids': [{'type': 'DOI', 'value': '10.1097/00005768-200002000-00030', 'is_inner': False, 'url': 'https://doi.org/10.1097/00005768-200002000-00030'}, {'type': 'PubMed', 'value': '10694132', 'is_inner': True, 'url': 'https://pubmed.ncbi.nlm.nih.gov/10694132/'}]}
    2. Alkner BA, Tesch PA, Berg HE (2000) Quadriceps EMG/force relationship in knee extension and leg press. Med Sci Sports Exerc 32:459–463 - PubMed
    1. {'text': '', 'ref_index': 1, 'ids': [{'type': 'DOI', 'value': '10.1002/mus.880180605', 'is_inner': False, 'url': 'https://doi.org/10.1002/mus.880180605'}, {'type': 'PubMed', 'value': '7753121', 'is_inner': True, 'url': 'https://pubmed.ncbi.nlm.nih.gov/7753121/'}]}
    2. Allen GM, Gandevia SC, McKenzie DK (1995) Reliability of measurements of muscle strength and voluntary activation using twitch interpolation. Muscle Nerve 18:593–600 - PubMed
    1. {'text': '', 'ref_index': 1, 'ids': [{'type': 'PubMed', 'value': '11717228', 'is_inner': True, 'url': 'https://pubmed.ncbi.nlm.nih.gov/11717228/'}]}
    2. Babault N, Pousson M, Ballay Y, Van Hoecke J (2001) Activation of human quadriceps femoris during isometric, concentric, and eccentric contractions. J Appl Physiol 91:2628–2634 - PubMed
    1. {'text': '', 'ref_index': 1, 'ids': [{'type': 'PubMed', 'value': '12571130', 'is_inner': True, 'url': 'https://pubmed.ncbi.nlm.nih.gov/12571130/'}]}
    2. Babault N, Pousson M, Michaut A, Van Hoecke J (2003) Effect of quadriceps femoris muscle length on neural activation during isometric and concentric contractions. J Appl Physiol 94:983–990 - PubMed
    1. {'text': '', 'ref_index': 1, 'ids': [{'type': 'DOI', 'value': '10.1152/japplphysiol.00737.2005', 'is_inner': False, 'url': 'https://doi.org/10.1152/japplphysiol.00737.2005'}, {'type': 'PubMed', 'value': '16282433', 'is_inner': True, 'url': 'https://pubmed.ncbi.nlm.nih.gov/16282433/'}]}
    2. Babault N, Desbrosses K, Fabre MS, Michaut A, Pousson M (2006) Neuromuscular fatigue development during maximal concentric and isometric knee extensions. J Appl Physiol 100:780–785 - PubMed

Publication types

LinkOut - more resources