Comparative Study
. 2007 Mar 14:8:21.
doi: 10.1186/1471-2202-8-21.

Spatiotemporal integration of tactile information in human somatosensory cortex

Affiliations
Comparative Study

Spatiotemporal integration of tactile information in human somatosensory cortex

Zhao Zhu et al. BMC Neurosci. .

Abstract

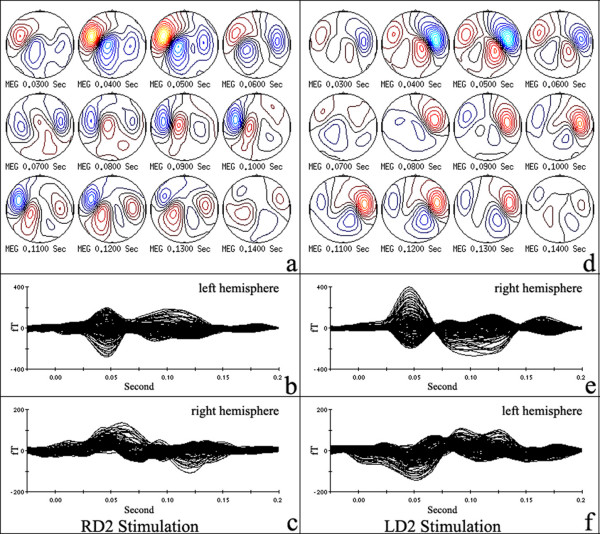
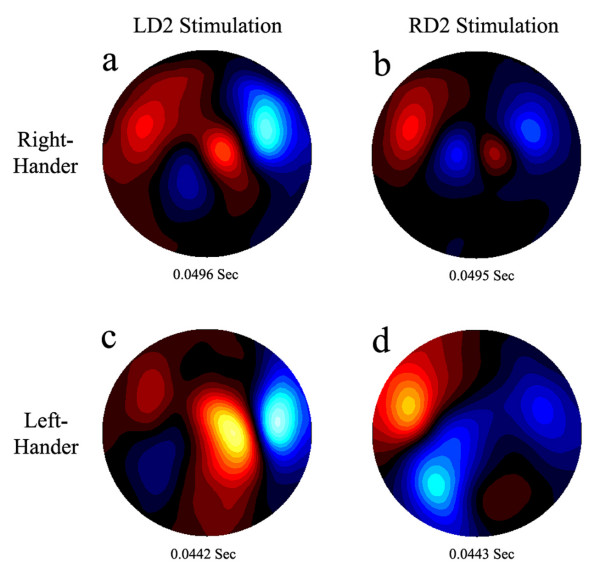
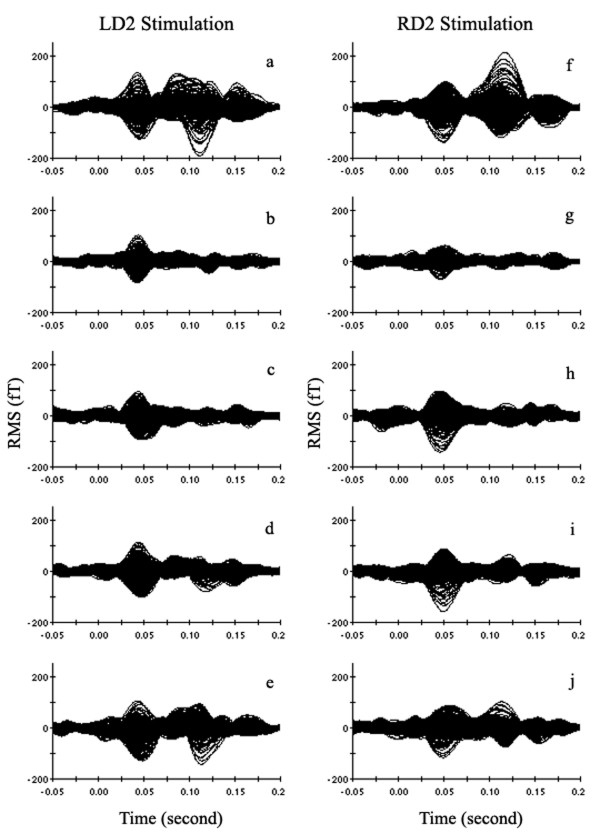
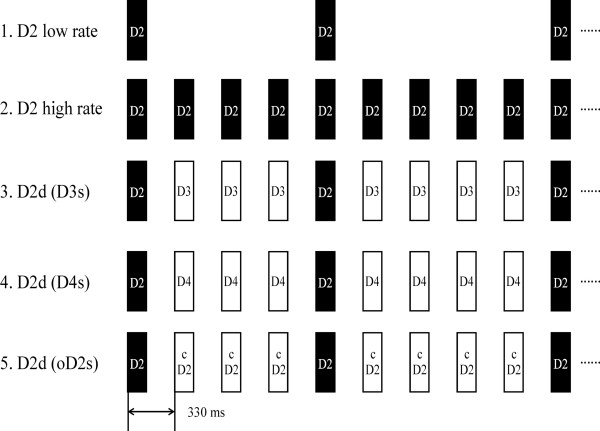
Background: Our goal was to examine the spatiotemporal integration of tactile information in the hand representation of human primary somatosensory cortex (anterior parietal somatosensory areas 3b and 1), secondary somatosensory cortex (S2), and the parietal ventral area (PV), using high-resolution whole-head magnetoencephalography (MEG). To examine representational overlap and adaptation in bilateral somatosensory cortices, we used an oddball paradigm to characterize the representation of the index finger (D2; deviant stimulus) as a function of the location of the standard stimulus in both right- and left-handed subjects.

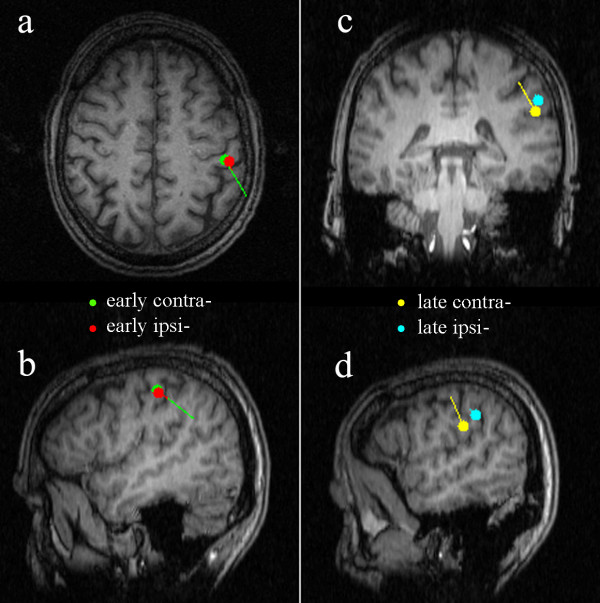
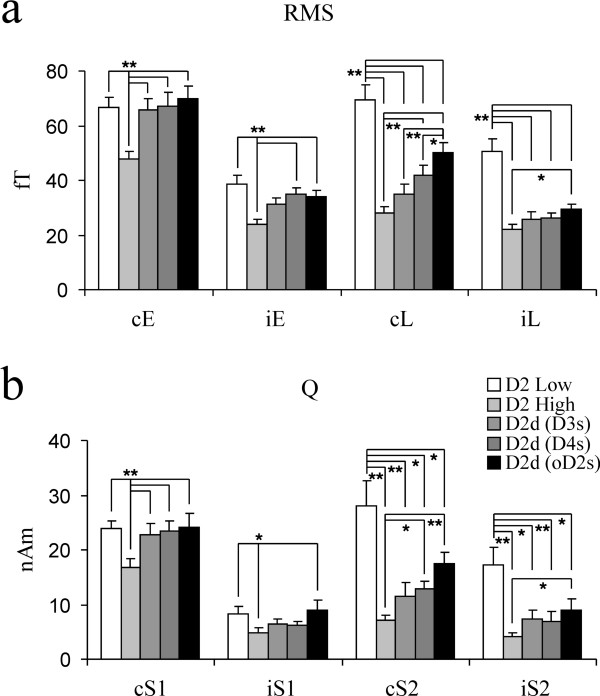
Results: We found that responses to deviant stimuli presented in the context of standard stimuli with an interstimulus interval (ISI) of 0.33 s were significantly and bilaterally attenuated compared to deviant stimulation alone in S2/PV, but not in anterior parietal cortex. This attenuation was dependent upon the distance between the deviant and standard stimuli: greater attenuation was found when the standard was immediately adjacent to the deviant (D3 and D2 respectively), with attenuation decreasing for non-adjacent fingers (D4 and opposite D2). We also found that cutaneous mechanical stimulation consistently elicited not only a strong early contralateral cortical response but also a weak ipsilateral response in anterior parietal cortex. This ipsilateral response appeared an average of 10.7 +/- 6.1 ms later than the early contralateral response. In addition, no hemispheric differences either in response amplitude, response latencies or oddball responses were found, independent of handedness.

Conclusion: Our findings are consistent with the large receptive fields and long neuronal recovery cycles that have been described in S2/PV, and suggest that this expression of spatiotemporal integration underlies the complex functions associated with this region. The early ipsilateral response suggests that anterior parietal fields also receive tactile input from the ipsilateral hand. The lack of a hemispheric difference in responses to digit stimulation supports a lack of any functional asymmetry in human somatosensory cortex.


Figures

Figure 1
Figure 1
Time courses of MEG maps and waveforms. Averaged responses to index finger tactile stimulation at low rate (stimulation condition 1 in Figure 6; the strongest response was observed under this condition) were recorded from a right-handed subject. The left and right columns show responses to RD2 and LD2 stimulation, respectively. The two top (a and d) panels represent the series of contour plots of sensor data showing the time course of the averaged evoked magnetic fields. Each plot shows the sensor data interpolated between the 275 sensors at different latencies. The nasion is pointing up, the right ear is to the right, and the left ear is to the left (top view). Panels b, c, e and f show averaged evoked magnetic field responses; each line depicts an average of the data from a single sensor over all trials for one condition. Panels b and e show response waveforms recorded from half of all sensors over the hemisphere contralateral to the stimulated index finger, c and f from the hemisphere ipsilateral to the stimulated index finger.
Figure 2
Figure 2
Source localizations of responses to index finger stimulation alone. Identified dipole sources of responses in the right hemisphere shown in Figure 1 are superimposed on this subject's MRI. The left horizontal (a) and sagittal (b) slices show the locations of early contralateral response (green dot in right anterior parietal field) to LD2 stimulation and early ipsilateral response (red dot) to RD2 stimulation. The coronal (c) and sagittal (d) slices in the right column show the locations of the late contralateral response (yellow dot in right S2) to LD2 stimulation and late ipsilateral response (cyan dot) to RD2 stimulation. The tails of those dots indicate dipoles' strength and direction.
Figure 3
Figure 3
Two ipsilateral early responses examples. The top two averaged sensor data plots are from a right-handed subject, the bottom two are from a left-handed subject. Figures in the left column show the two subjects' sensor plots at the early ipsilateral (left hemisphere) response peak moment under the LD2 stimulation condition. The peak ipsilateral (left hemisphere) response is still weaker than the contralateral (right hemisphere) response, though the right hemisphere response is not at its peak at this time. Figures in the right column show similar results for RD2 stimulation. Both LD2 and RD2 stimulation elicited bilateral early responses in these two subjects.
Figure 4
Figure 4
Spatial integration. Grand average of the peak sensor amplitude (a: RMS) and dipole moment (b: Q) values for early (anterior parietal area) and late (S2/PV) responses under different experimental conditions are compared. Asterisks indicate that the responses are significantly (*: p < 0.05; **: p < 0.01) different from others that are linked to it by the lines, using the Bonferroni post-hoc test. c, i, E and L stand for contralateral, ipsilateral, early and later response, respectively. S1 and S2 stand for anterior parietal areas and S2/PV respectively. D2 Low: D2 stimulation alone at low rate (condition 1 in Figure 6; mean ISI: 2s); D2 High: D2 stimulation alone at high rate (condition 2 in Figure 6; ISI: 0.33s); D2d (D3s): D2 deviant plus D3 standard stimuli (condition 3 in Figure 6; ISI: 0.33s); D2d (D4s): D2 deviant plus D4 standard stimuli (condition 4 in Figure 6; ISI: 0.33s); D2d (oD2s): D2 deviant plus opposite D2 standard stimuli (condition 5 in Figure 6; ISI: 0.33s).
Figure 5
Figure 5
An example of spatial integration obtained from a right-handed subject. The waveforms show the time courses of the averaged magnetic field responses recorded from 275 sensors under the different conditions. The left and right columns show contralateral sensor response waveforms for LD2 and RD2 stimulation, respectively. a and f: D2 stimulation alone at low rate (condition 1 in Figure 6; mean ISI: 2s); b and g: D2 stimulation alone at high rate (condition 2 in Figure 6; ISI: 0.33s); c and h: D2 deviant plus D3 standard stimulation (condition 3 in Figure 6; ISI: 0.33s); d and i: D2 deviant plus D4 standard stimulation (condition 4 in Figure 6; ISI: 0.33s); e and j: D2 deviant plus opposite D2 standard stimulation (condition 5 in Figure 6; ISI: 0.33s).
Figure 6
Figure 6
Stimulus paradigm. 1. Low rate (mean ISI; 2s) D2 stimulation (black bars) alone. 2. High rate (mean ISI: 0.33s) D2 stimulation alone. 3. Ipsilateral D3; 4. ipsilateral D4; 5. contralateral D2 as the standard stimulus respectively (white bars), with D2 as the deviant stimulus (black bars) in the digit mismatch paradigm. RD 3, 4 and LD 2 were used as standards with RD2 as deviants; LD 3, 4 and RD2 were used as standards with LD2 as deviants.

References

    1. Krubitzer LA, Kaas JH. The organization and connections of somatosensory cortex in marmosets. J Neurosci. 1990;10:952–74. - PMC - PubMed
    1. Krubitzer L, Clarey J, Tweedale R, Elston G, Calford M. A redefinition of somatosensory areas in the lateral sulcus of macaque monkeys. J Neurosci. 1995;15:3821–39. - PMC - PubMed
    1. Disbrow E, Roberts T, Krubitzer L. Somatotopic organization of cortical fields in the lateral sulcus of Homo sapiens: evidence for SII and PV. J Comp Neurol. 2000;418:1–21. doi: 10.1002/(SICI)1096-9861(20000228)418:1<1::AID-CNE1>3.0.CO;2-P. - DOI - PubMed
    1. Qi HX, Lyon DC, Kaas JH. Cortical and thalamic connections of the parietal ventral somatosensory area in marmoset monkeys (Callithrix jacchus) J Comp Neurol. 2002;443:168–82. doi: 10.1002/cne.10113. - DOI - PubMed
    1. Whitsel BL, Petrucelli LM, Werner G. Symmetry and connectivity in the map of the body surface in somatosensory area II of primates. J Neurophysiol. 1969;32:170–83. - PubMed

Publication types

LinkOut - more resources