Accommodation and induced myopia in marmosets
- PMID: 17360018
- PMCID: PMC1892168
- DOI: 10.1016/j.visres.2007.01.018
Accommodation and induced myopia in marmosets
Abstract
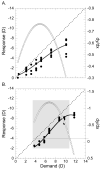
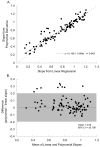
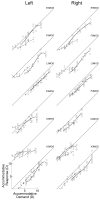
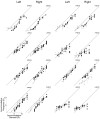
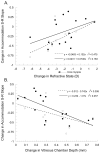
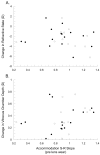
Accommodation may indirectly influence visually guided eye growth by affecting the retinal defocus signal used to guide growth. Specifically, increased lags of accommodation associated with low stimulus-response (S-R) function slopes will impose increased hyperopic blur on the retina and may induce axial elongation and myopia. The purpose of this study was (1) to measure accommodation in awake, free viewing marmosets and (2) compare accommodation behavior in marmosets before and after inducing different amounts of myopia with binocular spectacle lenses. In untreated marmosets, the average accommodation S-R slope approached one, but showed considerable inter-individual variability (mean+/-SD: 0.964+/-0.249 for monocular viewing; 0.895+/-0.235 for binocular viewing; monocular and binocular measures not significantly different). The monocular S-R slopes were significantly reduced following a period of lens rearing that produced axial myopia (change in slope=-0.30+/-0.30, p<.01) and the reduction in slope was proportional to the amount of myopia induced (p<.01). The S-R slopes measured either under monocular or binocular conditions before induction of myopia were not well correlated with the degree of myopia induced (monocular: r=-.240, p=.453; binocular: r=-.060, p=.824). These results support the hypothesis that the reduction in S-R slope in myopes is a consequence of the myopia induced. The alternative hypothesis-that low S-R slope increases susceptibility to the development of myopia--is not supported by the weak correlation between the pre-manipulation S-R slopes and the magnitude of the myopic shift.
Figures




Similar articles
-
Imposed anisometropia, accommodation, and regulation of refractive state.Optom Vis Sci. 2009 Jan;86(1):E31-9. doi: 10.1097/OPX.0b013e318194072e. Optom Vis Sci. 2009. PMID: 19104464 Free PMC article.
-
The effect of monocular and binocular viewing on the accommodation response to real targets in emmetropia and myopia.Optom Vis Sci. 2005 Apr;82(4):279-85. doi: 10.1097/01.opx.0000159369.85285.21. Optom Vis Sci. 2005. PMID: 15829856
-
An evaluation of the lag of accommodation using photorefraction.Vision Res. 2003 Feb;43(4):419-30. doi: 10.1016/s0042-6989(02)00571-0. Vision Res. 2003. PMID: 12535999
-
IMI Accommodation and Binocular Vision in Myopia Development and Progression.Invest Ophthalmol Vis Sci. 2021 Apr 28;62(5):4. doi: 10.1167/iovs.62.5.4. Invest Ophthalmol Vis Sci. 2021. PMID: 33909034 Free PMC article. Review.
-
'The role of accommodative function in myopic development: A review.'.Semin Ophthalmol. 2022 May 19;37(4):455-461. doi: 10.1080/08820538.2021.2006724. Epub 2021 Nov 25. Semin Ophthalmol. 2022. PMID: 34821535 Review.
Cited by
-
Animal modeling for myopia.Adv Ophthalmol Pract Res. 2024 Jun 5;4(4):173-181. doi: 10.1016/j.aopr.2024.06.001. eCollection 2024 Nov-Dec. Adv Ophthalmol Pract Res. 2024. PMID: 39263386 Free PMC article. Review.
-
A simpler primate brain: the visual system of the marmoset monkey.Front Neural Circuits. 2014 Aug 8;8:96. doi: 10.3389/fncir.2014.00096. eCollection 2014. Front Neural Circuits. 2014. PMID: 25152716 Free PMC article. Review.
-
The age-related pattern of inner retinal thickening is affected by myopia development and progression.Sci Rep. 2022 Dec 23;12(1):22190. doi: 10.1038/s41598-022-26598-w. Sci Rep. 2022. PMID: 36564498 Free PMC article.
-
Myopia: Mechanisms and Strategies to Slow Down Its Progression.J Ophthalmol. 2022 Jun 14;2022:1004977. doi: 10.1155/2022/1004977. eCollection 2022. J Ophthalmol. 2022. PMID: 35747583 Free PMC article. Review.
-
The effect of simultaneous negative and positive defocus on eye growth and development of refractive state in marmosets.Invest Ophthalmol Vis Sci. 2012 Sep 21;53(10):6479-87. doi: 10.1167/iovs.12-9822. Invest Ophthalmol Vis Sci. 2012. PMID: 22918633 Free PMC article.
References
-
- Abbott ML, Schmid KL, Strang NC. Differences in the accommodation stimulus response curves of adult myopes and emmetropes. Ophthalmic and Physiological Optics. 1998;18(1):13–20. - PubMed
-
- Allen PM, O'Leary DJ. Accommodation functions: co-dependency and relationship to refractive error. Vision Research. 2006;46(4):491–505. - PubMed
-
- Angle J, Wissmann DA. The epidemiology of myopia. America Journal of Epidemiology. 1980;111:220–228. - PubMed
-
- Atchison DA, Collins MJ, Wildsoet CF, Christensen J, Waterworth MD. Measurement of monochromatic ocular aberrations of human eyes as a function of accommodation by the Howland aberroscope technique. Vision Research. 1995;35(3):313–323. - PubMed
-
- Atchison DA, Schmid KL, Pritchard N. Neural and optical limits to visual performance in myopia. Vision Research. 2006;46(21):3707–3722. - PubMed
Publication types
MeSH terms
Grants and funding
LinkOut - more resources
Full Text Sources
Research Materials

