Sensitive ChIP-DSL technology reveals an extensive estrogen receptor alpha-binding program on human gene promoters
- PMID: 17360330
- PMCID: PMC1821125
- DOI: 10.1073/pnas.0700715104
Sensitive ChIP-DSL technology reveals an extensive estrogen receptor alpha-binding program on human gene promoters
Abstract
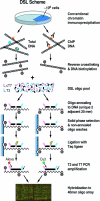
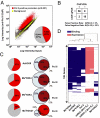
ChIP coupled with microarray provides a powerful tool to determine in vivo binding profiling of transcription factors to deduce regulatory circuitries in mammalian cells. Aiming at improving the specificity and sensitivity of such analysis, we developed a new technology called ChIP-DSL using the DNA selection and ligation (DSL) strategy, permitting robust analysis with much reduced materials compared with standard procedures. We profiled general and sequence-specific DNA binding transcription factors using a full human genome promoter array based on the ChIP-DSL technology, revealing an unprecedented number of the estrogen receptor (ERalpha) target genes in MCF-7 cells. Coupled with gene expression profiling, we found that only a fraction of these direct ERalpha target genes were highly responsive to estrogen and that the expression of those ERalpha-bound, estrogen-inducible genes was associated with breast cancer progression in humans. This study demonstrates the power of the ChIP-DSL technology in revealing regulatory gene expression programs that have been previously invisible in the human genome.
Figures


Similar articles
-
Genomic analyses of transcription factor binding, histone acetylation, and gene expression reveal mechanistically distinct classes of estrogen-regulated promoters.Mol Cell Biol. 2007 Jul;27(14):5090-104. doi: 10.1128/MCB.00083-07. Epub 2007 May 21. Mol Cell Biol. 2007. PMID: 17515612 Free PMC article.
-
Integration of cap analysis of gene expression and chromatin immunoprecipitation analysis on array reveals genome-wide androgen receptor signaling in prostate cancer cells.Oncogene. 2011 Feb 3;30(5):619-30. doi: 10.1038/onc.2010.436. Epub 2010 Oct 4. Oncogene. 2011. PMID: 20890304
-
Novel estrogen receptor-alpha binding sites and estradiol target genes identified by chromatin immunoprecipitation cloning in breast cancer.Cancer Res. 2007 May 15;67(10):5017-24. doi: 10.1158/0008-5472.CAN-06-3696. Cancer Res. 2007. PMID: 17510434
-
Dissecting regulatory networks in host-pathogen interaction using chIP-on-chip technology.Cell Host Microbe. 2009 May 8;5(5):430-7. doi: 10.1016/j.chom.2009.04.007. Cell Host Microbe. 2009. PMID: 19454347 Review.
-
Progress in DNA chip technology.Chin Med Sci J. 2001 Mar;16(1):59-62. Chin Med Sci J. 2001. PMID: 12899353 Review.
Cited by
-
Predictive models of eukaryotic transcriptional regulation reveals changes in transcription factor roles and promoter usage between metabolic conditions.Nucleic Acids Res. 2019 Jun 4;47(10):4986-5000. doi: 10.1093/nar/gkz253. Nucleic Acids Res. 2019. PMID: 30976803 Free PMC article.
-
9p21 DNA variants associated with coronary artery disease impair interferon-γ signalling response.Nature. 2011 Feb 10;470(7333):264-8. doi: 10.1038/nature09753. Nature. 2011. PMID: 21307941 Free PMC article.
-
Interaction of glucocorticoid receptor (GR) with estrogen receptor (ER) α and activator protein 1 (AP1) in dexamethasone-mediated interference of ERα activity.J Biol Chem. 2013 Aug 16;288(33):24020-34. doi: 10.1074/jbc.M113.473819. Epub 2013 Jun 28. J Biol Chem. 2013. PMID: 23814048 Free PMC article.
-
Genome-wide analysis of histone H3 lysine9 modifications in human mesenchymal stem cell osteogenic differentiation.PLoS One. 2009 Aug 27;4(8):e6792. doi: 10.1371/journal.pone.0006792. PLoS One. 2009. PMID: 19710927 Free PMC article.
-
Estrogen receptor alpha controls a gene network in luminal-like breast cancer cells comprising multiple transcription factors and microRNAs.Am J Pathol. 2010 May;176(5):2113-30. doi: 10.2353/ajpath.2010.090837. Epub 2010 Mar 26. Am J Pathol. 2010. PMID: 20348243 Free PMC article.
References
-
- Strahl BD, Allis CD. Nature. 2000;403:41–45. - PubMed
-
- Fischle W, Wang Y, Allis CD. Curr Opin Cell Biol. 2003;15:172–183. - PubMed
-
- Turner BM. BioEssays. 2000;22:836–845. - PubMed
-
- Sims RJ, III, Nishioka K, Reinberg D. Trends Genet. 2003;19:629–639. - PubMed
-
- Rosenfeld MG, Lunyak VV, Glass CK. Genes Dev. 2006;20:1405–1428. - PubMed
Publication types
MeSH terms
Substances
Grants and funding
LinkOut - more resources
Full Text Sources
Other Literature Sources

