. 2007 Mar 20;104(12):4820-3.
doi: 10.1073/pnas.0611338104. Epub 2007 Mar 13.

Large seasonal swings in leaf area of Amazon rainforests

Affiliations

Large seasonal swings in leaf area of Amazon rainforests

Ranga B Myneni et al. Proc Natl Acad Sci U S A. .

Abstract

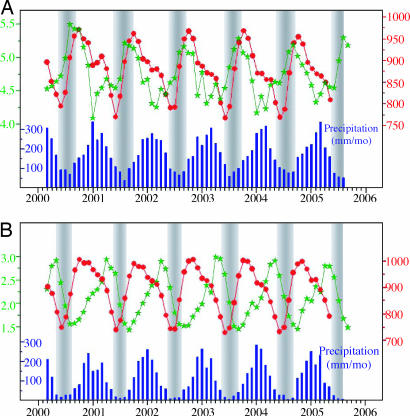
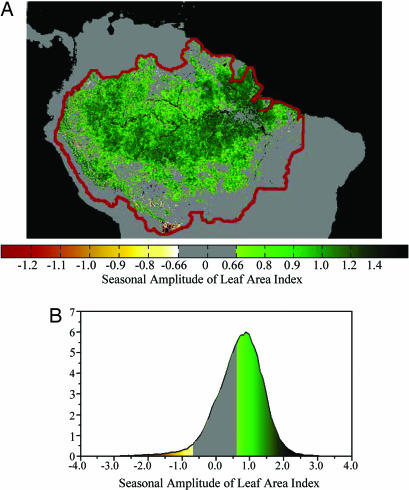
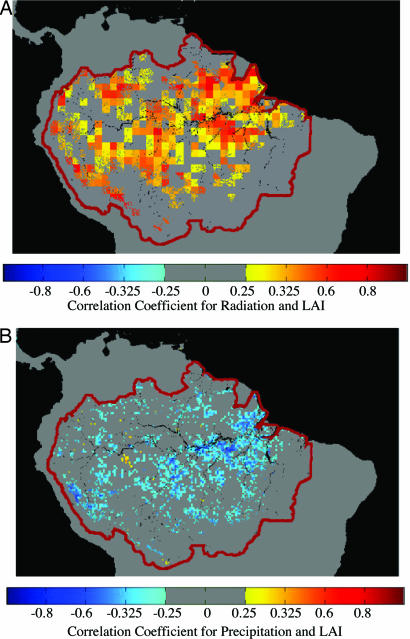
Despite early speculation to the contrary, all tropical forests studied to date display seasonal variations in the presence of new leaves, flowers, and fruits. Past studies were focused on the timing of phenological events and their cues but not on the accompanying changes in leaf area that regulate vegetation-atmosphere exchanges of energy, momentum, and mass. Here we report, from analysis of 5 years of recent satellite data, seasonal swings in green leaf area of approximately 25% in a majority of the Amazon rainforests. This seasonal cycle is timed to the seasonality of solar radiation in a manner that is suggestive of anticipatory and opportunistic patterns of net leaf flushing during the early to mid part of the light-rich dry season and net leaf abscission during the cloudy wet season. These seasonal swings in leaf area may be critical to initiation of the transition from dry to wet season, seasonal carbon balance between photosynthetic gains and respiratory losses, and litterfall nutrient cycling in moist tropical forests.


Conflict of interest statement

The authors declare no conflict of interest.

Figures

Fig. 1.
Fig. 1.
Time series of monthly LAI from the Terra MODIS instrument (green), monthly maximum of hourly average surface solar radiation from the Terra Clouds and the Earth's Radiant Energy System (CERES) and Geostationary Operational Environmental Satellite 8 (GOES-8) instruments (red), and monthly merged precipitation from the Tropical Rainfall Measuring Mission (TRMM) and other sources (blue). (A) Time series based on data averaged over all Amazon rainforest pixels, as identified in the MODIS land cover map (SI Fig. 4B), south of the equator. The start of the data record is March 2000 and the end points are September 2005 (LAI), May 2005 (solar radiation), and August 2005 (precipitation). The shaded areas denote dry seasons, defined as months with precipitation <100 mm or less than one-third the precipitation range [0.33·(maximum–minimum) + minimum]. The solar radiation data are for all sky conditions and include direct and diffuse components. (B) Same as A except that the data are from savanna and grassland pixels adjacent to the Amazon basin in Brazil and south of the equator (SI Fig. 4B). The shaded areas denote dry seasons, defined as months with precipitation <50 mm. Information on the data is given in SI Materials and Methods.
Fig. 2.
Fig. 2.
Seasonal amplitude of LAI. (A) Color-coded map of LAI amplitudes greater than 0.66 or less than −0.66; this threshold (|0.66|) is the smallest LAI difference discernable with the MODIS LAI data set (see SI Materials and Methods). In regions with dry seasons longer than 3 months, the amplitude is calculated as the difference between the maximum 4-month average LAI in the dry season minus the minimum 4-month average LAI in the wet season. Where the dry season is three or fewer months, the amplitude is calculated as the difference between the dry-season average LAI and the minimum 4-month average LAI in the wet season. The dry and wet seasons are defined based on the precipitation data set at 15′ spatial resolution (see SI Materials and Methods). Thus, the seasons vary spatially and interannually. (B) Distribution of LAI amplitude for all Amazon rainforest pixels. The color scheme is similar to that in A.
Fig. 3.
Fig. 3.
Correlation coefficients. (A) Correlation between first differences of LAI and solar radiation. The first differences of LAI [ΔLAI(t)] are calculated as LAI(t + 1) − LAI(t), where t is months in the timeline March 2000 to May 2005. The number of data points is 62 for each pixel. Correlation coefficients greater than 0.25 or less than −0.25 are shown (P < 0.05). The analysis was performed for rainforest pixels with LAI amplitudes greater than 0.66 or less than −0.66; this threshold (|0.66|) is the smallest LAI difference discernable with the MODIS LAI data set (see SI Materials and Methods). (B) Correlation between first differences of LAI and precipitation.

References

    1. van Schaik CP, Terborgh JW, Wright SJ. Annu Rev Ecol Syst. 1993;24:353–377.
    1. Wright SJ. In: Tropical Forest Plant Ecophysiology. Mulkey SS, Chazdon RL, Smith AP, editors. New York: Chapman & Hall; 1996. pp. 440–460.
    1. Morellato PC. In: Phenology: An Integrative Environmental Science. Schwartz MD, editor. Dordrecht, The Netherlands: Kluwer; 2003. pp. 75–92.
    1. Wright SJ, van Schaik CP. Am Nat. 1994;143:192–199.
    1. Borchert R. Ecology. 1994;75:1437–1449.

Publication types

LinkOut - more resources