. 2007 Mar 20;104(12):5133-8.
doi: 10.1073/pnas.0610634104. Epub 2007 Mar 8.

Lipidomics reveals control of Mycobacterium tuberculosis virulence lipids via metabolic coupling

Affiliations

Lipidomics reveals control of Mycobacterium tuberculosis virulence lipids via metabolic coupling

Madhulika Jain et al. Proc Natl Acad Sci U S A. .

Abstract

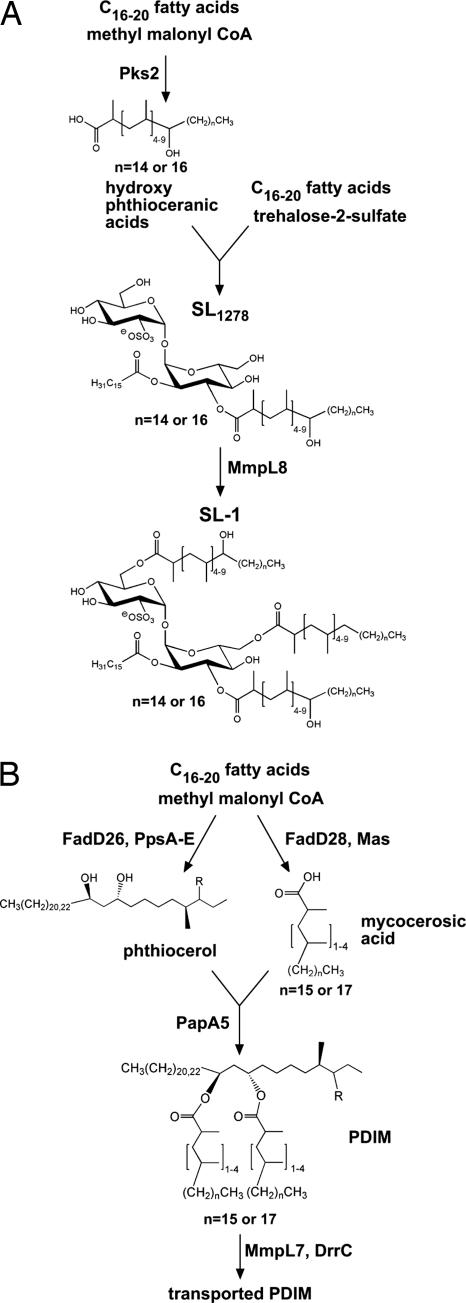
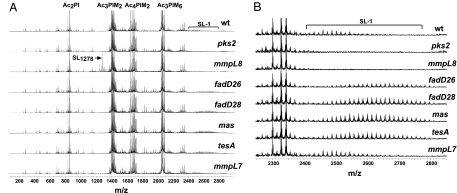
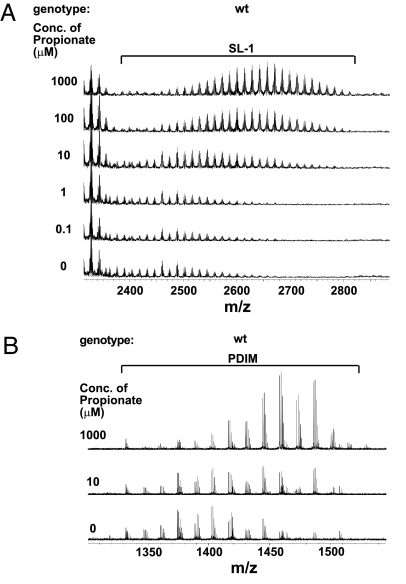
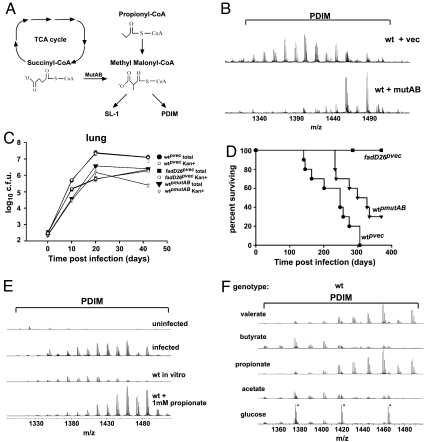
Mycobacterium tuberculosis synthesizes specific polyketide lipids that interact with the host and are required for virulence. Using a mass spectrometric approach to simultaneously monitor hundreds of lipids, we discovered that the size and abundance of two lipid virulence factors, phthiocerol dimycocerosate (PDIM) and sulfolipid-1 (SL-1), are controlled by the availability of a common precursor, methyl malonyl CoA (MMCoA). Consistent with this view, increased levels of MMCoA led to increased abundance and mass of both PDIM and SL-1. Furthermore, perturbation of MMCoA metabolism attenuated pathogen replication in mice. Importantly, we detected increased PDIM synthesis in bacteria growing within host tissues and in bacteria grown in culture on odd-chain fatty acids. Because M. tuberculosis catabolizes host lipids to grow during infection, we propose that growth of M. tuberculosis on fatty acids in vivo leads to increased flux of MMCoA through lipid biosynthetic pathways, resulting in increased virulence lipid synthesis. Our results suggest that the shift to host lipid catabolism during infection allows for increased virulence lipid anabolism by the bacterium.


Conflict of interest statement

The authors declare no conflict of interest.

Figures

Fig. 1.
Fig. 1.
Pathways of SL-1 and PDIM biosynthesis. (A) The structure of SL1278 (4, 5) and SL-1 as proposed by Goren (33) is shown. The trehalose-2-sulfate core is esterified with two hydroxy-phthioceranic groups, one phthioceranic group and a palmitate or stearate. (B) The structures of phthiocerol, mycocerosic acids and PDIM are shown. Pps, phthiocerol synthase; Mas, mycocerosic acid synthase. PDIM consists of two mycocerosic acids esterified to phthiocerol. Mas synthesizes the methyl branched mycocerosic acids through successive additions of MMCoA (8, 9), whereas PpsA-E synthesize phthiocerol (10). FadD26 and FadD28 are responsible for activating straight chain fatty acids for transfer to Pps and Mas, respectively (34). MmpL7 and DrrC are required for transport of PDIM to the cell wall (2, 3).
Fig. 2.
Fig. 2.
Increased abundance and mass of SL-1 in PDIM synthesis mutants. (A) Crude lipid extracts prepared from M. tuberculosis cultures from the indicated strains were analyzed in negative ion mode by FT-ICR MS. SL-1, sulfolipid-1; PI, phosphatidyl inositol; PIM, phosphatidyl inositol mannoside; Ac, acyl chain. The phosphatidylinositol (PI) linkers esterified with two acyl chains (Ac2PI, m/z 835.5355 for PI esterified to palmitate and oleate, and m/z 851.5638 for PI esterified to palmitate and tuberculostearate) were observed within 2 ppm of their theoretical masses (24, 35). The dimannose species esterified to three acyl chains (Ac3PIM2, m/z 1413.8988) and the hexamannose species esterified to three acyl chains (Ac3PIM6, m/z 2062.1079) were also observed. Multiple lipoforms of SL-1 (m/z 2401.1544 to 2639.3480) and SL1278 (m/z 1277.9394) are also indicated. (B) The SL-1 regions of the spectra obtained in A are shown. SL-1 is observed as a broad set of peaks separated by 14 amu corresponding to differing numbers of CH2 units.
Fig. 3.
Fig. 3.
Addition of propionate leads to increased abundance and mass of SL-1 and PDIM. Increasing concentrations of propionate were added to wild-type M. tuberculosis cells over the course of three doublings and SL-1 (A) and PDIM (B) were monitored by using FT-ICR MS.
Fig. 4.
Fig. 4.
Regulation of PDIM and SL-1 synthesis during infection. (A) Pathway depicting the production and incorporation of MMCoA into PDIM and SL-1. MMCoA can be synthesized from propionyl CoA or from succinyl CoA via the action of MutAB. (B) PDIM region of FT-ICR mass spectra of crude extracts from wild-type M. tuberculosis containing either the MutAB expression construct or an empty vector as a control. (C and D) Overexpression of MutAB leads to attenuated growth in a mouse model of infection. BALB/C mice were infected via the aerosol route with bacteria containing either an empty vector (circles) or the MutAB expression construct (inverted triangles), or fadD26 bacteria containing an empty vector (squares). The data shown here is from one representative experiment of two. (C) Growth in the lung was monitored by harvesting at the indicated timepoints and plating dilutions on solid media containing kanamycin (open symbols) or without antibiotic (filled symbols). Growth on media without kanamycin revealed the total number of bacteria, whereas growth on media containing kanamycin revealed the number of bacteria that retained the plasmid. Each data point represents the average colony-forming units (cfu) from four to five infected mice, and error bars indicate the standard deviation of the means. (D) Survival of mice (n = 10 per group). (E) PDIM is produced in higher mass forms in a mouse model of M. tuberculosis infection. BALB/C mice were infected with a high dose (≈1,400 cfu) of wild-type M. tuberculosis, and lungs were harvested 19 days after infection. Bacillary loads in the lung at this timepoint were 8 × 10⁸ colony-forming units (cfu). Lipids were extracted from lungs and analyzed by FT-ICR MS. The data shown here are from one representative experiment of two. FT-ICR mass spectra from wild-type M. tuberculosis cells grown in vitro, with or without propionate, as described in Fig. 3B are also shown here for comparison. Average mass of PDIM in vivo is 1,430 amu as compared with 1,403 amu for cells grown in vitro without propionate and 1,456 amu for cells grown in the presence of 1 mM propionate. (F) PDIM region of FT-ICR mass spectra of crude extracts from wild-type cells grown on 0.1% glucose, or 10 mM acetate, propionate, butyrate or valerate as a sole carbon cource. Three contaminating peaks of polyethylene glycol from residual Tween-80 in the sample are marked with an asterisk in the spectra for cells grown on glucose.

References

    1. Brennan PJ, Nikaido H. Annu Rev Biochem. 1995;64:29–63. - PubMed
    1. Cox JS, Chen B, McNeil M, Jacobs WR., Jr Nature. 1999;402:79–83. - PubMed
    1. Camacho LR, Ensergueix D, Perez E, Gicquel B, Guilhot C. Mol Microbiol. 1999;34:257–267. - PubMed
    1. Converse SE, Mougous JD, Leavell MD, Leary JA, Bertozzi CR, Cox JS. Proc Natl Acad Sci USA. 2003;100:6121–6126. - PMC - PubMed
    1. Domenech P, Reed MB, Dowd CS, Manca C, Kaplan G, Barry CE., III J Biol Chem. 2004;279:21257–21265. - PubMed

Publication types

LinkOut - more resources