Comparative Study
. 2007 Apr 3;104(14):5732-7.
doi: 10.1073/pnas.0609812104. Epub 2007 Mar 12.

Homogenization of regional river dynamics by dams and global biodiversity implications

Affiliations
Comparative Study

Homogenization of regional river dynamics by dams and global biodiversity implications

N Leroy Poff et al. Proc Natl Acad Sci U S A. .

Abstract

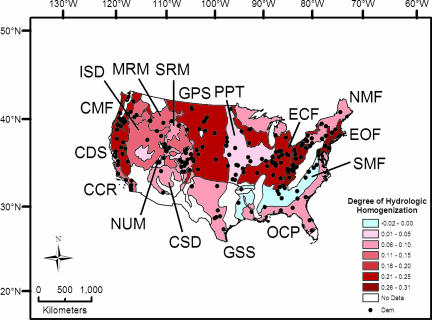
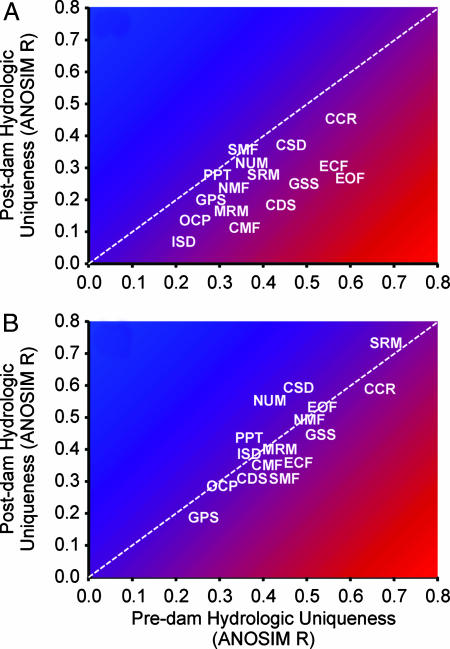
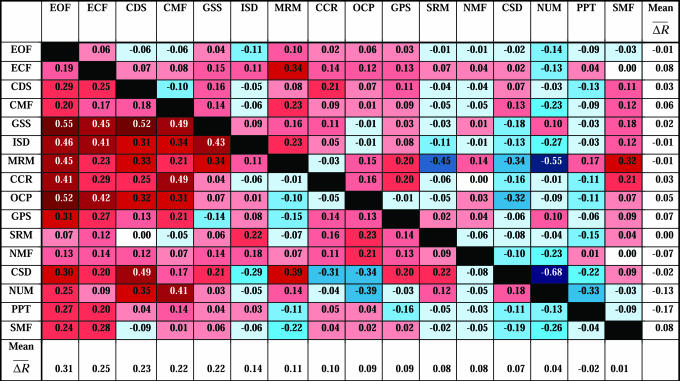
Global biodiversity in river and riparian ecosystems is generated and maintained by geographic variation in stream processes and fluvial disturbance regimes, which largely reflect regional differences in climate and geology. Extensive construction of dams by humans has greatly dampened the seasonal and interannual streamflow variability of rivers, thereby altering natural dynamics in ecologically important flows on continental to global scales. The cumulative effects of modification to regional-scale environmental templates caused by dams is largely unexplored but of critical conservation importance. Here, we use 186 long-term streamflow records on intermediate-sized rivers across the continental United States to show that dams have homogenized the flow regimes on third- through seventh-order rivers in 16 historically distinctive hydrologic regions over the course of the 20th century. This regional homogenization occurs chiefly through modification of the magnitude and timing of ecologically critical high and low flows. For 317 undammed reference rivers, no evidence for homogenization was found, despite documented changes in regional precipitation over this period. With an estimated average density of one dam every 48 km of third- through seventh-order river channel in the United States, dams arguably have a continental scale effect of homogenizing regionally distinct environmental templates, thereby creating conditions that favor the spread of cosmopolitan, nonindigenous species at the expense of locally adapted native biota. Quantitative analyses such as ours provide the basis for conservation and management actions aimed at restoring and maintaining native biodiversity and ecosystem function and resilience for regionally distinct ecosystems at continental to global scales.


Conflict of interest statement

The authors declare no conflict of interest.

Figures

Fig. 1.
Fig. 1.
Hydroregion map and dam locations (dots) used in analysis for the continental United States. Shading of the individual regions refers to degree of regional homogenization in flow regimes in the postdam period (see Fig. 3). White regions were excluded because of inadequate dam-gauge pairs.
Fig. 2.
Fig. 2.
Changes in flow regime similarity for 16 regions over the course of the 20th century. (A) Data for 186 dammed rivers. (B) Data for 317 unregulated, reference rivers. x axis scores represent a region's hydrologic uniqueness before regulation (mean predam ΔR), and y axis scores are postdam uniqueness (mean postdam ΔR). The 1:1 dotted line is the expected relationship between predam and postdam flow regimes for the null hypothesis of no change over time. Regions plotting below this line have become less distinct in the postdam period (homogenization) and those above have become more distinct (differentiation) relative to other regions. See Methods for assignment of reference rivers to predam and postdam periods.
Fig. 3.
Fig. 3.
Results from the ANOSIM showing all pairwise differences between the 16 hydroregions for the predam vs. postdam flow regimes. Each cell represents a specific pairwise comparison, with colored shading representing the degree of homogenization. Increasing intensity of red indicates greater positive values of ΔR (i.e., interregional flow homogenization), white shading indicates ΔR = 0, and increasing intensity of blue indicates greater negative values ΔR (i.e., interregional flow differentiation). The black diagonal separates the pairwise comparisons for the regulated rivers (below diagonal) to those for unregulated, reference rivers (above diagonal). The average of the 15 pairwise comparisons for each regions is the average regional homogenization score for that region (ΔR), as plotted in Fig. 1. The ΔRs for the regulated rivers are given across the bottom row and for the reference rivers in the right-most column (e.g., EOF regulated ΔR = 0.31 and EOF unregulated ΔR = −0.01). Visual inspection reveals that inter-regional homogenization is greater for regulated rivers (lower matrix, average ΔR = 0.13) than unregulated rivers (upper matrix, average ΔR = 0.00).
Fig. 4.
Fig. 4.
Relative contributions of 16 hydrologic metrics to flow homogenization for dammed rivers in 16 hydroregions. Metrics include magnitude, duration, frequency, and timing for average high flows and low flows and their interannual coefficient of variation (CV). For each region, the size of the circle represents the percent change in the relative importance of the metric for describing interregional flow difference from predam to postdam periods. Filled symbols indicate an increase in the magnitude of the metric from predam to postdam period for each region, and unfilled symbols indicate a decrease. Regions are ordered from left to right according to the increasing degree of homogenization (i.e., based on the mean ΔR).

Comment in

  • Homogenous rivers, homogenous faunas.
    Moyle PB, Mount JF. Moyle PB, et al. Proc Natl Acad Sci U S A. 2007 Apr 3;104(14):5711-2. doi: 10.1073/pnas.0701457104. Epub 2007 Mar 28. Proc Natl Acad Sci U S A. 2007. PMID: 17392424 Free PMC article. No abstract available.

References

    1. Millennium Ecosystem Assessment. Ecosystems and Human Well-being: Biodiversity Synthesis. Washington, DC: World Resour Inst; 2005.
    1. Landres PB, Morgan P, Swanson FJ. Ecol Appl. 1999;9:1179–1188.
    1. Sala OE, Chapin FS, Armesto JJ, Berlow E, Bloomfield J, Dirzo R, Huber-Sanwald E, Huennake LF, Jackson RB, Kinzig A, et al. Science. 2000;287:1770–1774. - PubMed
    1. Western D. Proc Natl Acad Sci USA. 1998;98:5458–5465. - PMC - PubMed
    1. Olden JD, Poff NL, Douglas MR, Douglas ME, Fausch KD. Trends Ecol Evol. 2004;19:18–24. - PubMed

Publication types