. 2007 Mar 20;104(12):4864-9.
doi: 10.1073/pnas.0607812104. Epub 2007 Mar 13.

Simultaneous reduction of iron-sulfur protein and cytochrome b(L) during ubiquinol oxidation in cytochrome bc(1) complex

Affiliations

Simultaneous reduction of iron-sulfur protein and cytochrome b(L) during ubiquinol oxidation in cytochrome bc(1) complex

Jian Zhu et al. Proc Natl Acad Sci U S A. .

Abstract

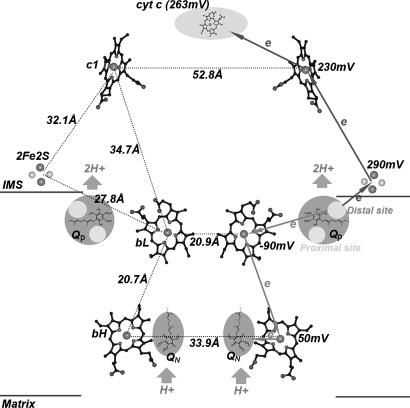
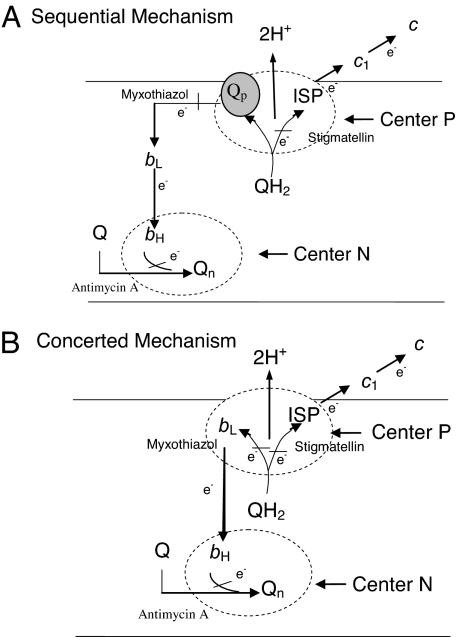
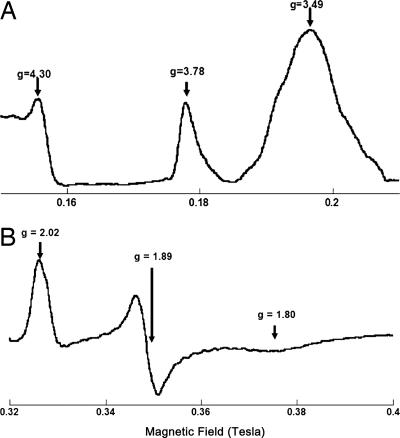
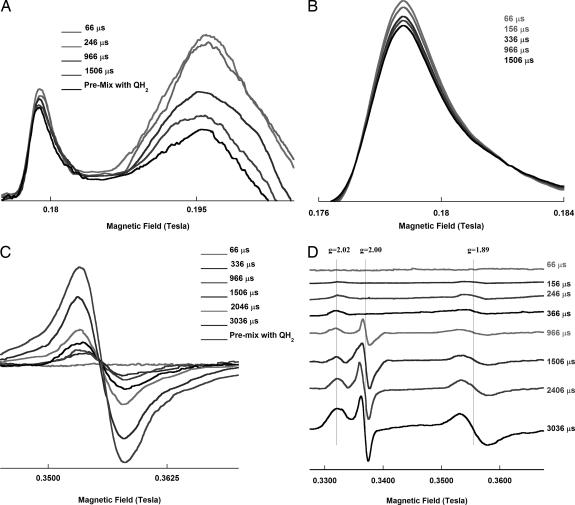
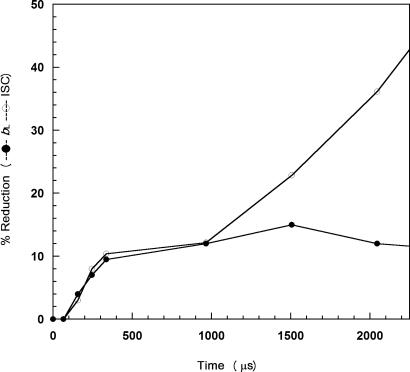
The key step of the protonmotive Q-cycle mechanism of the cytochrome bc(1) complex is the bifurcated oxidation of ubiquinol at the Qp site. It was postulated that the iron-sulfur protein (ISP) accepts the first electron from ubiquinol to generate ubisemiquinone anion to reduce b(L). Because of the difficulty of following the reduction of ISP optically, direct evidence for the early involvement of ISP in ubiquinol oxidation is not available. Using the ultra-fast microfluidic mixer and the freeze-quenching device, coupled with EPR, we have been able to determine the presteady-state kinetics of ISP and cytochrome b(L) reduction by ubiquinol. The first-phase reduction of ISP starts as early as 100 micros with a t(1/2) of 250 micros. A similar reduction kinetic is also observed for cytochrome b(L), indicating a simultaneous reduction of both ISP and b(L). These results are consistent with the fact that no ubisemiquinone was detected at the Qp site during oxidation of ubiquinol. Under the same conditions, by using stopped flow, the reduction rates of cytochromes b(H) and c(1) were 403 s(-1) (t(1/2) 1.7 ms) and 164 s(-1) (t(1/2) 4.2 ms), respectively.


Conflict of interest statement

The authors declare no conflict of interest.

Figures

Fig. 1.
Fig. 1.
The relative location of the essential redox groups of the bovine heart mitochondrial cytochrome bc1 complex (59). The bL, bH, and c1 hemes are shown as ball-and-stick models, whereas the 2Fe2S clusters are shown as ball models. The quinone oxidation pockets are near the intermembrane space (IMS) side of the membrane, and the quinol reduction pockets are near the matrix side of the membrane. Cytochrome c is shown as a shaded oval as labeled. Distances between redox centers are given on the left, and the redox potential for each center is given on the right. The high potential ET path is depicted by arrowed lines pointing upward, and the low potential ET path is shown by arrowed lines pointing downward. Circles in the upper and lower parts within the Qp pockets are distal and proximal quinone bindings, respectively.
Fig. 2.
Fig. 2.
The proton motive Q-cycle mechanism. (A) Sequential bifurcated oxidation of quinol at the Qp site. Ubiquinol bound in cytochrome b is first oxidized by ISP to generate an ubisemiquinone radical to reduce cytochrome bL. (B) Concerted bifurcated oxidation of ubiquinol at the Qp site. Bifurcated oxidation of ubiquinol at the Qp site by ISP and cytochrome bL takes place simultaneously with no generation of ubisemiquinone radical at the Qp site.
Fig. 3.
Fig. 3.
EPR spectra of oxidized cytochromes b and c1 (A) and the reduced Rieske ISP (B). The spectra were taken at 6 K, with the following instrument settings: microwave frequency, 9.45 GHz; modulation amplitude, 6.30 G; modulation frequency, 100 KHz; time constant, 0.655 s.
Fig. 4.
Fig. 4.
EPR spectra of cytochromes b and c1 and the reduced Rieske ISP at various time points after mixing with ubiquinol. The EPR spectra of cytochromes bL and bH/c1 (A and B) and ISC (C and D) in the cytochrome bc1 complex reacting with ubiquinol are shown at different time points as indicated. B and C are the EPR spectra of cytochrome bL and ISC at gy = 1.89, respectively. D shows the EPR spectra of ISC with g = 2.00 region. Samples were prepared as described in Experimental Procedures. The EPR spectra were taken at 6 K, with the following instrument settings: microwave frequency, 9.45 GHz; microwave power, 2.15 mW; and modulation frequency, 100 KHz; time constant, 0.655 s. The modulation amplitude used was 19.57 and 6.30 G for cytochromes and ISP, respectively. All curves are in the same order as the reaction times given.
Fig. 5.
Fig. 5.
The degree of reduction of ISC and heme bL against time. ISC (○) and heme bL (●) reduction percentage by QH2, calculated from EPR spectra, at time points between 0 and 1 ms and 0 to 2.25 ms. The percentage reduction of bL was calculated based on percentage decrease in the integrated area of EPR peak at 3.78 using the peak area of the fully oxidized complex as 100%. The percentage reduction of ISC was based on the signal intensity of gy in the sample that was premixed with QH2 as 100%.

References

    1. Trumpower BL, Gennis RB. Annu Rev Biochem. 1994;63:675–716. - PubMed
    1. Berry E, Guergova-Kuras MH, Huang L-S, Crofts AR. Annu Rev Biochem. 2000;69:1007–1077. - PubMed
    1. Xia D, Yu CA, Kim H, Xia JZ, Kachurin AM, Zhang L, Yu L, Deisenhofer J. Science. 1997;277:60–66. - PMC - PubMed
    1. Iwata S, Lee JW, Okada K, Lee JK, Iwata M, Rasmussen B, Link TA, Ramaswamy S, Jap BK. Science. 1998;281:64–71. - PubMed
    1. Zhang ZL, Huang L-S, Shulmeister VM, Chi Y-I, Kim KK, Huang L-W, Crofts AR, Berry EA, Kim S-H. Nature. 1998;392:677–684. - PubMed

Publication types

LinkOut - more resources