. 2007 Mar 6;104(10):3707-12.
doi: 10.1073/pnas.0611585104. Epub 2007 Feb 28.

Scanning tunneling microscopy of the formation, transformation, and property of oligothiophene self-organizations on graphite and gold surfaces

Affiliations

Scanning tunneling microscopy of the formation, transformation, and property of oligothiophene self-organizations on graphite and gold surfaces

Zhi-Yong Yang et al. Proc Natl Acad Sci U S A. .

Abstract

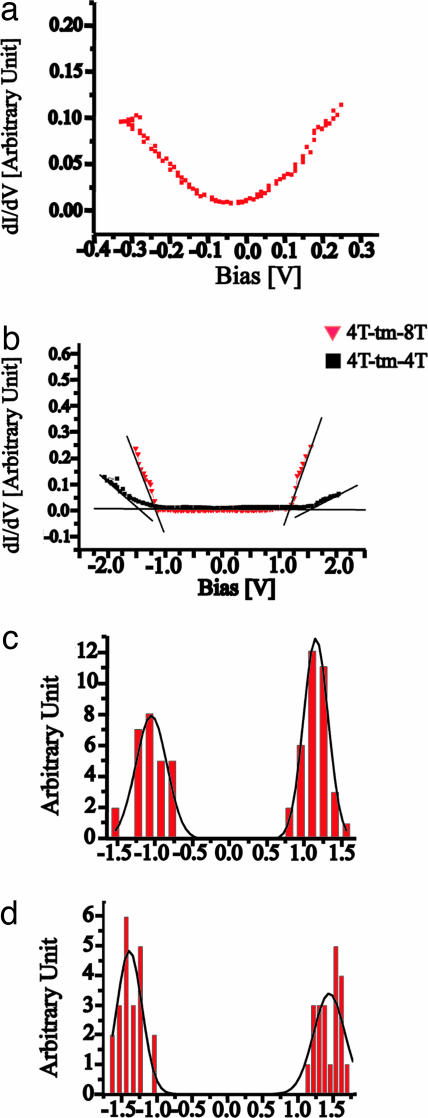
Two alkyl-substituted dual oligothiophenes, quarterthiophene (4T)-trimethylene (tm)-octithiophene (8T) and 4T-tm-4T, were used to fabricate molecular structures on highly oriented pyrolytic graphite and Au(111) surfaces. The resulted structures were investigated by scanning tunneling microscopy. The 4T-tm-8T and 4T-tm-4T molecules self-organize into long-range ordered structures with linear and/or quasi-hexagonal patterns on highly oriented pyrolytic graphite at ambient temperature. Thermal annealing induced a phase transformation from quasi-hexagonal to linear in 4T-tm-8T adlayer. The molecules adsorbed on Au(111) surface in randomly folded and linear conformation. Based on scanning tunneling microscopy results, the structural models for different self-organizations were proposed. Scanning tunneling spectroscopy measurement showed the electronic property of individual molecules in the patterns. These results are significant in understanding the chemistry of molecular structure, including its formation, transformation, and electronic properties. They also help to fabricate oligothiophene assemblies with desired structures for future molecular devices.


Conflict of interest statement

The authors declare no conflict of interest.

Figures

Scheme 1.
Scheme 1.
Chemical structure of 4T-tm-8T (a) and 4T-tm-4T (b).
Fig. 1.
Fig. 1.
STM images and model of 47-tm-8T quasi-hexagonal adlayer. (a) Large-scale STM image of 4T-tm-8T adlayer on HOPG in a quasi-hexagonal symmetry. The tunneling current is 0.724 nA with a bias of 0.6 V. (b) High-resolution STM image of a. The tunneling current is 0.651 nA with a bias of −0.6 V. (Inset) The tunneling current is 0.611 nA with a bias of 0.698 V. (c) Structural model of the 4T-tm-8T quasi-hexagonal adlayer.
Fig. 2.
Fig. 2.
STM images and model of 47-tm-8T linear adlayer. (a) Large-scale STM image of 4T-tm-8T linear adlayer on HOPG. The tunneling current is 0.644 nA with a bias of −0.508 V. (b) High-resolution STM image of a. The imaging conditions are the same as those in a. (c) Proposed structural model of the linear adlayer.
Fig. 3.
Fig. 3.
STM image after annealing 4T-tm-8T adlayer at 100°C in ambient condition. The tunneling current is 0.648 nA with a bias of 0.62 V.
Fig. 4.
Fig. 4.
STM image of 4T-tm-8T adlayer on Au(111) in 0.1 M HClO4 at 0.532 V. The tunneling current is 0.827 nA with a bias of −0.186 V.
Fig. 5.
Fig. 5.
STM images and model of 4T-tm-4T adlayer. (a) Large-scale STM image of 4T-tm-4T adlayer on HOPG. The tunneling current is 0.767 nA with a bias of 0.650 V. (b) High-resolution STM image of a. The tunneling current is 0.642 nA with a bias of 0.395 V. (c) Structural model of the 4T-tm-4T adlayer.
Fig. 6.
Fig. 6.
STM images and model of 4T-tm-4T adlayer. (a) Large-scale STM image of 4T-tm-4T adlayer on HOPG. The tunneling current is 0.685 nA with a bias of −0.763 V. (b) High-resolution STM image of a. The tunneling current is 0.61 nA with a bias of −0.763 V. (c) Structural model for the 4T-tm-4T adlayer.
Fig. 7.
Fig. 7.
STM image of 4T-tm-4T adlayer on Au(111) in 0.1 M HClO4 at 0.520 V. The tunneling current is 0.742 nA with a bias of −0.174 V.
Fig. 8.
Fig. 8.
STS results of bare HOPG, 4T-tm-8T, and 4T-tm-4T. (a) Typical dI/dV-V curve obtained on bare HOPG. (b) Typical dI/dV-V curve obtained on 4T-tm-8T and 4T-tm-4T adlayers on HOPG in ambient condition. (c) The histogram of experimental gap edges of 4T-tm-8T molecules. The black solid lines show a G fit of the columns. (d) The histogram of experimental gap edges of 4T-tm-4T molecules. The black solid lines show a G fit of the columns.

Similar articles

Cited by

References

    1. Azumi R, Götz G, Debaerdemaeker T, Bäuerle P. Chem Eur J. 2000;6:735–744. - PubMed
    1. Bäuerle P. Adv Mater. 1992;4:102–107.
    1. Bäuerle P, Fischer T, Bidlingmeier B, Stabel A, Rabe JP. Angew Chem Int Ed. 1995;34:303–307.
    1. Leclère P, Surin M, Viville P, Lazzaroni R, Kilbinger AFM, Henze O, Feast WJ, Cavallini M, Biscarini F, Schenning APHJ, Meijer EW. Chem Mater. 2004;16:4452–4466.
    1. Gong JR, Yan HJ, Yuan QH, Xu LP, Bo ZS, Wan LJ. J Am Chem Soc. 2006;128:12384–12385. - PubMed

Publication types

LinkOut - more resources