. 2007 Mar 6;104(10):3759-64.
doi: 10.1073/pnas.0611577104. Epub 2007 Feb 26.

Structures of the extracellular regions of the group II/III metabotropic glutamate receptors

Affiliations

Structures of the extracellular regions of the group II/III metabotropic glutamate receptors

Takanori Muto et al. Proc Natl Acad Sci U S A. .

Abstract

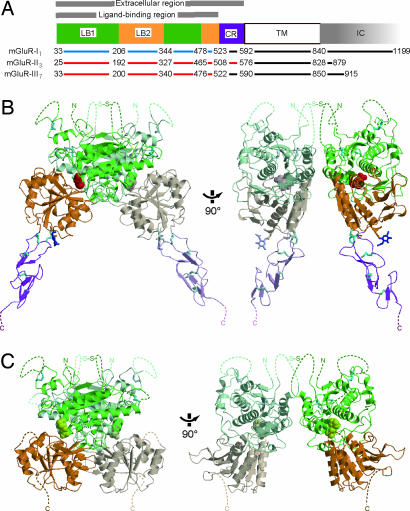
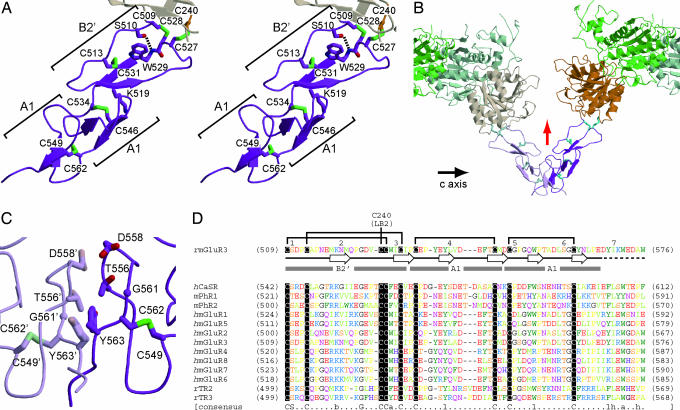
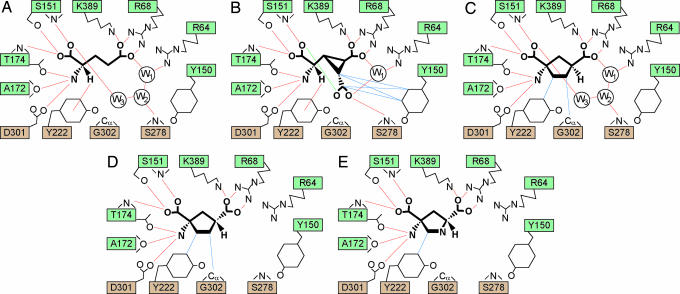
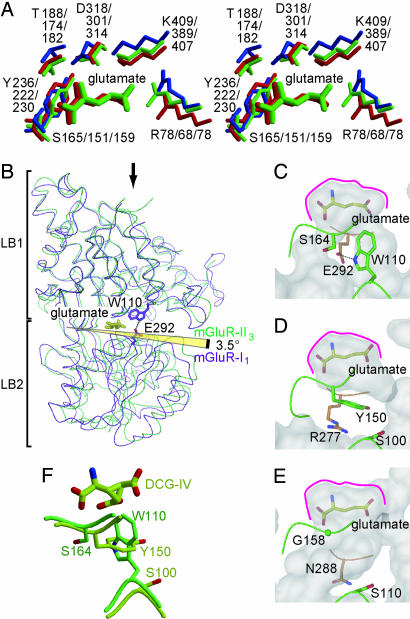
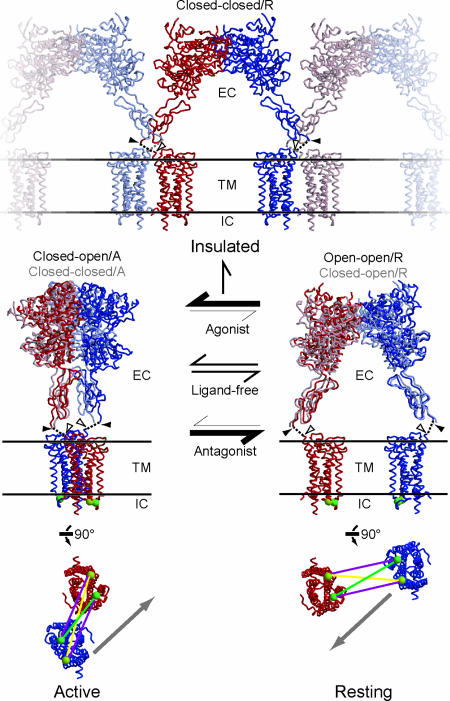
Metabotropic glutamate receptors play major roles in the activation of excitatory synapses in the central nerve system. We determined the crystal structure of the entire extracellular region of the group II receptor and that of the ligand-binding region of the group III receptor. A comparison among groups I, II, and III provides the structural basis that could account for the discrimination of group-specific agonists. Furthermore, the structure of group II includes the cysteine-rich domain, which is tightly linked to the ligand-binding domain by a disulfide bridge, suggesting a potential role in transmitting a ligand-induced conformational change into the downstream transmembrane region. The structure also reveals the lateral interaction between the two cysteine-rich domains, which could stimulate clustering of the dimeric receptors on the cell surface. We propose a general activation mechanism of the dimeric receptor coupled with both ligand-binding and interprotomer rearrangements.


Conflict of interest statement

The authors declare no conflict of interest.

Figures

Fig. 1.
Fig. 1.
Architecture of mGluRs. (A) Domain architecture of mGluRs. The red lines in mGluR-II3 and mGluR-III7 indicate the region used for the present crystallographic analyses. Similarly, the blue line in mGluR-I1 indicates the region analyzed in our previous studies (4, 5). (B) Two orthogonal views of the mGluR-II3 EC region complexed with Glu. The noncrystallographic two-fold axis runs on the paper plane in both of the drawings. Each domain is colored as in A. Cyan and blue stick models represent disulfide linkages and sugar molecules attached at N209, respectively. Bound glutamate molecules are illustrated by red space-filling models. The disordered segments are represented by broken lines. The two protomers are distinguished by dark/faint colors to depict the dimeric architecture. (C) Overall architecture of the mGluR-III7 ligand-binding region, as illustrated in B. Yellow space-filling models represent the bound 2-(N-morpholino)ethanesulfonic acid molecules.
Fig. 2.
Fig. 2.
CR domain. (A) Stereo diagram showing the CR domain, colored as in Fig. 1B. Each of the three modular structures is bracketed. (B) Interaction between the two neighboring CR domains along with the crystallographic c axis. The left molecule is drawn in faint colors to visualize the intermolecular interface. The red arrow indicates the noncrystallographic two-fold axis. (C) Close-up view of the interface. Stick models represent residues on the interface in addition to cysteine residues forming disulfide linkages. (D) Multiple sequence alignment of the CR domain in the family C GPCRs, including human calcium-sensing receptor (hCaSR), murine pheromone receptors EC1-V2R (mPhR1), and EC2-V2R (mPhR2); human mGluR subtypes 1–8 (hmGluR1–8); and rat taste receptors type 1 members 2 (rTR2) and 3 (rTR3). The primary and secondary structures of rat mGluR-II3 (rmGluR3) are shown on the top. The bottom line indicates the conserved residues among these receptors. Capital letters represent the specific amino acid type. Otherwise, a, b, h, and l represent aromatic residue, basic residue, hydrophobic residue, and residue carrying a large hydrophobic moiety, respectively.
Fig. 3.
Fig. 3.
Agonist recognition by mGluR-II3. Schematic drawings for the binding of Glu (A), DCG-IV (B), 1S,3S-ACPD (C), 1S,3R-ACPD (D), and 2R,4R-APDC (E). Hydrogen atoms attached at the Cα atom of the ligands are modeled with the corresponding ideal geometries. Only the residues/water molecules that directly interact with one of the agonists are drawn. Red and blue lines indicate hydrogen-bonding and VDW contact, respectively. Either of the two carboxyl oxygen atoms connected by the green line in B is likely to be protonated, as suggested from the short distance between them (2.4 Å).
Fig. 4.
Fig. 4.
The ligand-binding pocket. (A) Conserved amino acid residues involved in ligand binding. Red, green, and blue stick models represent the structures for mGluR-I1, mGluR-II3, and mGluR-III7, respectively. The three closed protomers were superimposed by least-square fitting. The model of the closed mGluR-III7 was constructed as described in the text. (B) Difference in the open angle of the closed protomer between mGluR-I1 (purple) and mGluR-II3 (green). The yellow stick model represents the bound Glu. The black arrow indicates the view direction in A. (C–E) The ligand-binding pockets of mGluR-I1 (C), mGluR-II3 (D), and mGluR-III7 (E) as viewed in A. Each molecular model is colored as in Fig. 1B. Red lines indicate the conserved surface shown in A. (F) Diagram representing the DCG-IV binding of mGluR-II3, viewed from directions similar to that in A. The structure of the closed protomers of mGluR-I1 (green) (4) is superimposed onto the mGluR-II3 structures (yellow).
Fig. 5.
Fig. 5.
Hypothetical model for mGluR activation. Three structural models represent the active (bottom, left), resting (bottom, right), and insulated (top) states, respectively. Each model, viewed in parallel to the membrane, was constructed by using the atomic coordinates of mGluR-II3 EC (present work) and rhodopsin (26). For clarity, the closed–open/A and open–open/R conformations are highlighted in the active and resting states, respectively, with dark colors, whereas the other possible conformations are drawn with faint colors. In all of these models, the C termini of the EC region (black arrowheads) are anchored to the same position at the corresponding TM. The position is separated by ≈12 Å from the N terminus of the first TM helix (white arrowheads). The distance is long enough for the nine residues to connect the two regions in mGluR (black broken lines). Yellow and green spheres indicate the Cα atoms of the residues representing loops I (K67; connecting the first and second TM helices) and II (R147; connecting the third and fourth TM helices), respectively. The interatomic distances for I–I (yellow lines) (66 Å in A; 54 Å in R), II–II (green lines) (42 Å in A; 55 Å in R), and I–II (purple lines) (53 Å in A; 53 Å in R) are consistent with the experimental data (13). The A-to-R transition in the dynamic equilibrium could induce lateral translation of the blue TM, as indicated by the gray arrows.

Similar articles

Cited by

References

    1. Pin JP, Galvez T, Prézeau L. Pharmacol Ther. 2003;98:325–354. - PubMed
    1. Nakanishi S, Masu M. Annu Rev Biophys Biomol Struct. 1994;23:319–348. - PubMed
    1. Hollmann M, Heinemann S. Annu Rev Neurosci. 1994;17:31–108. - PubMed
    1. Kunishima N, Shimada Y, Tsuji Y, Sato T, Yamamoto M, Kumasaka T, Nakanishi S, Jingami H, Morikawa K. Nature. 2000;407:971–977. - PubMed
    1. Tsuchiya D, Kunishima N, Kamiya N, Jingami H, Morikawa K. Proc Natl Acad Sci USA. 2002;99:2660–2665. - PMC - PubMed

Publication types