. 2007 Mar 6;104(10):3835-40.
doi: 10.1073/pnas.0607134104. Epub 2007 Feb 28.

On the mechanism of wing size determination in fly development

Affiliations

On the mechanism of wing size determination in fly development

Lars Hufnagel et al. Proc Natl Acad Sci U S A. .

Abstract

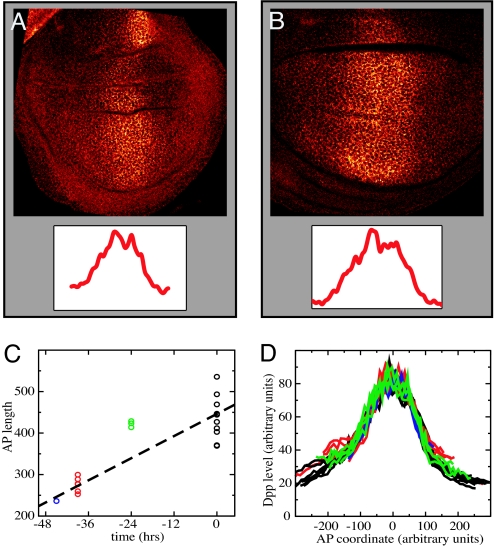
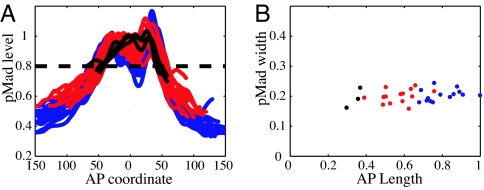
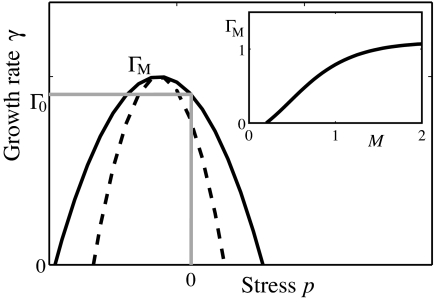
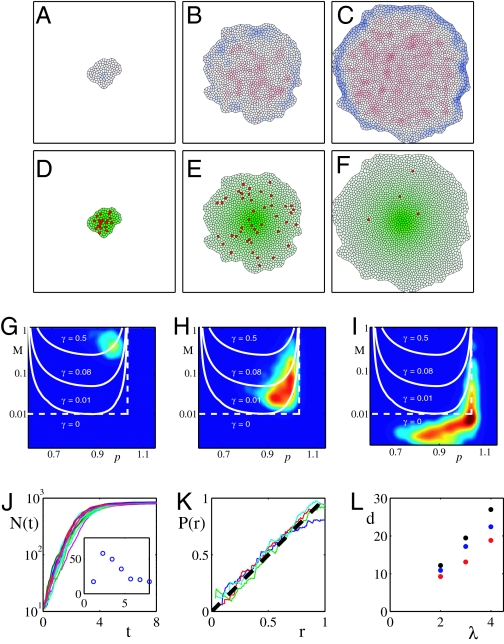
A fundamental and unresolved problem in animal development is the question of how a growing tissue knows when it has achieved its correct final size. A widely held view suggests that this process is controlled by morphogen gradients, which adapt to tissue size and become flatter as tissue grows, leading eventually to growth arrest. Here, we present evidence that the decapentaplegic (Dpp) morphogen distribution in the developing Drosophila wing imaginal disk does not adapt to disk size. We measure the distribution of a functional Dpp-GFP transgene and the Dpp signal transduced by phospho-Mad and show that the characteristic length scale of the Dpp profile remains approximately constant during growth. This finding suggests an alternative scenario of size determination, where disk size is determined relative to the fixed morphogen distribution by a certain threshold level of morphogen required for growth. We propose that when disk boundary reaches the threshold the arrest of cell proliferation throughout the disk is induced by mechanical stress in the tissue. Mechanical stress is expected to arise from the nonuniformity of morphogen distribution that drives growth. This stress, through a negative feedback on growth, can compensate for the nonuniformity of morphogen, achieving uniform growth with the rate that vanishes when disk boundary reaches the threshold. The mechanism is demonstrated through computer simulations of a tissue growth model that identifies the key assumptions and testable predictions. This analysis provides an alternative hypothesis for the size determination process. Novel experimental approaches will be needed to test this model.


Conflict of interest statement

The authors declare no conflict of interest.

Figures

Fig. 1.
Fig. 1.
Imaging Dpp-GFP in imaginal discs. (A and B) Confocal images (×130) of a wing imaginal discs expressing Dpp-GFP in the endogenous Dpp domain using Dpp-Gal4, stained for extracellular Dpp-GFP. The discs are of different ages: 40 h (A) and 0 h (B) before wandering stage. (Insets) Dpp-GFP profiles along the AP axis. (C) Dependence of wing pouch size on disk age (measured in hours before the wandering stage). (D) Compilation of Dpp–GFP profiles (along the AP axis). Groups of discs of different ages are in different colors (as in C). To eliminate variability of image intensity between different samples, the profiles were normalized by average intensity in the Dpp-producing region (next to the AP boundary). The approximate overlap of the profiles indicates that the shape of the Dpp profiles does not significantly change with time and increasing disk size.
Fig. 2.
Fig. 2.
Lack of disk size dependence for pMad profiles. (A) pMad immunofluorescence profiles along the AP axis for different discs. Profiles were normalized to their anterior maximum intensity and aligned at the AP boundary. (B) The pMad profile width as a function of disk size. Profile width is defined arbitrarily by a dashed line in A. Colors indicate different age groups (blue, at the wandering stage; red, 1 day before wandering; and black, 2 days before wandering).
Fig. 3.
Fig. 3.
Rate of cell proliferation (in the model) depends on morphogen levels and mechanical strain. Schematic shows functional dependence of the growth rate Γ on the lateral stress p within the cell layer for a fixed morphogen level. The dashed line indicates stronger mechanical feedback. The essential feature is the inhibition of growth by sufficiently high stress. A thinner layer, P < 0, corresponds to cells under tensile stress, whereas P > 0 corresponds to compression. We chose the maximum growth rate to occur at P < 0 as suggested by the observation that tension promotes growth in epithelial cell cultures (50, 60). (Inset) Maximal growth rate ΓM(M) as a function of morphogen level. The essential feature here is the threshold M0 and the monotonic increase with M.
Fig. 4.
Fig. 4.
Numerical simulation of the mechanical feedback model of disk size determination. (A–C) Snapshots of the simulated growth at different times with A corresponding to the start of the simulation, B the intermediate time, and C close to cessation of growth. Color code indicates layer deformation with red corresponding to lateral compression (ξ − 1 > 0) and blue corresponding to tension (ξ − 1 > 0). (D–F) Shown (green) is the level of morphogen M(r) peaked at its source cell. Cells that are about to divide are marked red (this is intended to emulate BrdU staining of mitotic cells). Note that cell proliferation is approximately uniform throughout the disk as is the case for in vivo observations (61, 62). This uniformization of growth is a result of the mechanical feedback mediated by the build-up of compression (as seen in A–C), which compensates for the excess of morphogen in the central region. Shortly after the disk expands beyond the range where morphogen is above threshold, the build-up of stress arrests growth throughout the disk (F). (G–I) Shown is the distribution of cells in the (M, ξ) parameter plane at three different times corresponding to A–C). Also shown (white) are the lines of constant rate of growth. Note that cells cluster along the lines of constant growth rate, which decreases with time and is close to zero in I, which corresponds to growth arrest. (J) Total number of cells as a function of time for 20 different runs of simulated disk growth (as shown in A–C). Note that rms fluctuations are significant early during growth but are reduced by the time of growth arrest as shown in G Inset. (K) Probability of cell division at distance r from the morphogen source. Linear dependence on r corresponds to uniform growth. Different traces correspond to different times with blue just before growth arrest. The uniformity of growth is a consequence of the mechanical feedback used in the simulation. (L) Disk size as a function of growth parameters. Average final diameter of the disk versus λ, the characteristic length scale of morphogen, for different values of the morphogen level, m, and the strength of mechanical feedback, q. Blue corresponds to the (m, q) values (see Methods) used in the simulation in A–F); black corresponds to “overexpressed” morphogen (2m, q), which leads to larger discs; red corresponds to increased feedback (m, 2q), which decreases disk size. Note that disk size scales with the morphogen length scale λ.
Fig. 5.
Fig. 5.
Effect of Dally and Dlp overexpression on pMad profiles. Late third-instar wing discs labeled to visualize pMad·UAS-Dlp overexpressed by enGAL4 (A), WT (B), and UAS-Dally overexpressed by enGAL4 (C). The corresponding pMad intensity profiles (unscaled) are shown at the bottom. Note the enhanced spread and elevated level of pMad in the posterior (to the right) of the wing pouch caused by Dally overexpression and the somewhat reduced spread of pMad in the posterior caused by Dlp overexpression. (Magnification: ×84.)
Fig. 6.
Fig. 6.
Effect of Dally and Dlp overexpression on the disk size and pMad length scales. (A) Overexpression of Dally and Dlp in the posterior compartment with enGAL4 had different effects on the disk size. Whereas Dally overexpression caused an increase in the size of the posterior compartment LP relative to the anterior compartment size LA, Dlp overexpression yielded a slight reduction of the posterior compartment size. Data are from 10 discs each. (B) Correlation between pMad length scale and disk size. For each disk, the length scale of the pMad extend of the pMad profile in the anterior dA and posterior dP compartment were measured as described in Fig. 2 (see also SI Fig. 9).

Similar articles

Cited by

References

    1. Lawrence PA, Struhl G. Cell. 1996;85:951–961. - PubMed
    1. Gurdon JB, Dyson S, St Johnston D. Cell. 1998;95:159–162. - PubMed
    1. Gurdon JB, Bourillot PY. Nature. 2001;413:797–803. - PubMed
    1. Held LIJ. Imaginal Discs: The Genetic and Cellular Logic of Pattern Formation. Cambridge, UK: Cambridge Univ Press; 2002.
    1. Ashe HL, Briscoe J. Development (Cambridge, UK) 2006;133:385–394. - PubMed

Publication types

Substances