

Predicting response to breast cancer neoadjuvant chemotherapy using diffuse optical spectroscopy
- PMID: 17360469
- PMCID: PMC1805697
- DOI: 10.1073/pnas.0611058104
Predicting response to breast cancer neoadjuvant chemotherapy using diffuse optical spectroscopy
Abstract
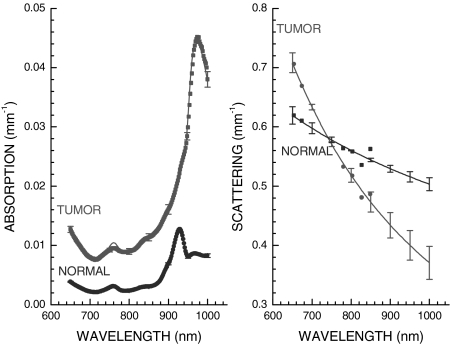
Diffuse optical spectroscopy (DOS) and imaging are emerging diagnostic techniques that quantitatively measure the concentration of deoxy-hemoglobin (ctHHb), oxy-hemoglobin (ctO(2)Hb), water (ctH(2)O), and lipid in cm-thick tissues. In early-stage clinical studies, diffuse optical imaging and DOS have been used to characterize breast tumor biochemical composition and monitor therapeutic response in stage II/III neoadjuvant chemotherapy patients. We investigated whether DOS measurements obtained before and 1 week into a 3-month adriamycin/cytoxan neoadjuvant chemotherapy regimen can predict final, postsurgical pathological response. Baseline DOS measurements of 11 patients before therapy revealed significant increases in tumor ctHHb, ctO(2)Hb, ctH(2)O, and spectral scattering slope, and decreases in bulk lipids, relative to normal breast tissue. Tumor concentrations of ctHHb, ctO(2)Hb, and ctH(2)O dropped 27 +/- 15%, 33 +/- 7%, and 11 +/- 15%, respectively, within 1 week (6.5 +/- 1.4 days) of the first treatment for pathology-confirmed responders (n = 6), whereas nonresponders (n = 5) and normal side controls showed no significant changes in these parameters. The best single predictor of therapeutic response 1 week posttreatment was ctHHb (83% sensitivity, 100% specificity), while discrimination analysis based on combined ctHHb and ctH(2)O changes classified responders vs. nonresponders with 100% sensitivity and specificity. In addition, the pretreatment tumor-to-normal ctO(2)Hb ratio was significantly higher in responders (2.82 +/- 0.44) vs. nonresponders (1.82 +/- 0.49). These results highlight DOS sensitivity to tumor cellular metabolism and biochemical composition and demonstrate its potential for predicting and monitoring an individual's response to treatment.
Conflict of interest statement
Conflict of interest statement: One patent has been issued and another is pending for the DOS technology developed by A.C. and B.J.T. and described in this work.
Figures


References
-
- Carlson RW, Favret AM. Breast J. 1999;5:303–307. - PubMed
-
- Mankoff DA, Dunnwald LK, Gralow JR, Ellis GK, Drucker MJ, Livingston RB. Cancer. 1999;85:2410–2423. - PubMed
-
- Esteva FJ, Hortobagyi GN. Hematol Oncol Clin North Am. 1999;13:457–472. vii. - PubMed
-
- Hortobagyi GN. Cancer. 1990;66:1387–1391. - PubMed
-
- De Lena M, Varini M, Zucali R, Rovini D, Viganotti G, Valagussa P, Veronesi U, Bonadonna G. Cancer Clin Trials. 1981;4:229–236. - PubMed
Publication types
MeSH terms
Substances
Grants and funding
LinkOut - more resources
Full Text Sources
Other Literature Sources
Medical
