. 2007 Mar 6;104(10):4083-8.
doi: 10.1073/pnas.0601117104. Epub 2007 Feb 28.

Adenosine regulation of alveolar fluid clearance

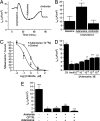
Affiliations

Adenosine regulation of alveolar fluid clearance

Phillip Factor et al. Proc Natl Acad Sci U S A. .

Abstract

Adenosine is a purine nucleoside that regulates cell function through G protein-coupled receptors that activate or inhibit adenylyl cyclase. Based on the understanding that cAMP regulates alveolar epithelial active Na(+) transport, we hypothesized that adenosine and its receptors have the potential to regulate alveolar ion transport and airspace fluid content. Herein, we report that type 1 (A(1)R), 2a (A(2a)R), 2b (A(2b)R), and 3 (A(3)R) adenosine receptors are present in rat and mouse lungs and alveolar type 1 and 2 epithelial cells (AT1 and AT2). Rat AT2 cells generated and produced cAMP in response to adenosine, and micromolar concentrations of adenosine were measured in bronchoalveolar lavage fluid from mice. Ussing chamber studies of rat AT2 cells indicated that adenosine affects ion transport through engagement of A(1)R, A(2a)R, and/or A(3)R through a mechanism that increases CFTR and amiloride-sensitive channel function. Intratracheal instillation of low concentrations of adenosine (< or =10(-8)M) or either A(2a)R- or A(3)R-specific agonists increased alveolar fluid clearance (AFC), whereas physiologic concentrations of adenosine (> or =10(-6)M) reduced AFC in mice and rats via an A(1)R-dependent pathway. Instillation of a CFTR inhibitor (CFTR(inh-172)) attenuated adenosine-mediated down-regulation of AFC, suggesting that adenosine causes Cl(-) efflux by means of CFTR. These studies report a role for adenosine in regulation of alveolar ion transport and fluid clearance. These findings suggest that physiologic concentrations of adenosine allow the alveolar epithelium to counterbalance active Na(+) absorption with Cl(-) efflux through engagement of the A(1)R and raise the possibility that adenosine receptor ligands can be used to treat pulmonary edema.


Conflict of interest statement

The authors declare no conflict of interest.

Figures

Fig. 1.
Fig. 1.
Adenosine receptor expression in lung and alveolar epithelial cells. (A) RT-PCR for A1R, A2aR, A2bR, and A3R in total RNA harvested from (left to right) mouse AT2 cells, mouse distal lung, rat AT1 cells, rat AT2 cells, rat distal lung. (B) LCM. Photomicrographs show alveoli before and after microdissection. A photo of representative cells collected is shown (Center). Graph is A1R, A2aR, A2bR, and A3R mRNA expression (n = 6 rats) measured by using real-time, quantitative RT-PCR, and normalized to GAPDH mRNA. (C) Western blot analysis of AR expression (left to right) mouse AT2 cell homogenates, peripheral lung homogenates, whole-cell membranes from peripheral lung (T), peripheral lung membrane enriched for apical (A), and basolateral (B) membrane domains. Blots for A1R and A2aR are 10 μg of protein per lane, and A2bR and A3R are 20 μg of protein per lane. (D) Western blot analysis of AR expression (left to right) rat AT1 and AT2 cell homogenates, peripheral lung homogenates, whole cell membranes from peripheral lung (T), peripheral lung membrane enriched for apical (A) and basolateral (B) membrane domains. Blots for A1R and A2aR used 10 μg of protein per lane, and A2bR and A3R used 20 μg of protein per lane.
Fig. 2.
Fig. 2.
A1R and A2aR function in rat AT2 cells. (A) Change in whole-cell cAMP concentration in response to the A1R agonist CCPA (10−5 M for 10 min). Cells were pretreated with the adenylyl cyclase activator forskolin (2 μM for 10 min) with and without pertussis toxin (100 ng/ml for 4 h) before addition of CCPA for 10 min. ∗, P = 0.03 vs. cells treated with vehicle only (Ctl), ∗∗, P < 0.01 vs. cells treated with forskolin only. (B) Whole-cell cAMP concentration in rat AT2 cells treated with incremental concentrations of the A2aR agonist CGS 21680 (10 min). ∗, P < 0.02 vs. vehicle-treated controls (Ctl).
Fig. 3.
Fig. 3.
Electrophysiologic studies in rat AT2 cell monolayers. (A) Typical tracing of short circuit current (Isc) before and after addition of adenosine and amiloride. (B) Change in short circuit current (ΔIsc) across high-resistance monolayers of rat AT2 cells after 4 d in culture in the presence or absence of adenosine. Change is calculated as adenosine-induced current − baseline current measured in the presence of vehicle (water). ∗, P < 0.009 vs. baseline current. (C) Monolayer resistance of adenosine- or vehicle (control)-treated AT2 cells. Baseline values for all Isc measurements were obtained after stabilization of Isc and before addition of adenosine or vehicle. (D) Change in short circuit current (ΔIsc) across monolayers of rat AT2 cells treated with the doses shown of the A1R agonist CPA. ∗, P < 0.01 vs. control (n = 3). (E) ΔIsc produced by AT2 cells treated with the doses shown of the A2aR agonist CGS 21680. ∗, P < 0.04 vs. baseline (n = 3). (F)(ΔIsc produced by rat AT2 cells concomitantly treated with (adenosine, 10−6 M) and the A2aR antagonist ZM 241385 (10−6 M). ∗, P < 0.01 vs. vehicle (water)-treated control (n = 3). (G) ΔIsc in rat AT2 cells treated with the nonspecific type 2 receptor agonist NECA (3 × 10⁻⁶ M) with and without the A2bR-specific antagonist MRS 1706 (10−5 M). n = 3 filters. (H) ΔIsc from baseline in rat AT2 cells treated with the A3R-specific agonist MECA at the doses shown. n = 3 filters. ∗, P < 0.02 vs. baseline Isc.
Fig. 4.
Fig. 4.
Effect of adenosine on Na+ and Cl transporter. (A) Tracing from a representative study of cells with basal membranes permeabilized with amphotericin B (10 μM) before application of adenosine (10−6 M). (B) Net effect of amiloride (10 μM) on Isc in permeabilized, adenosine (10−6 M)- treated cells. Data are peak Isc of basally permeabilized AT2 cells in the presence of an apical-to-basal Na+ gradient (145:25 mM). n = 3 (adenosine) or 4 (control and amiloride) filters per condition. ∗, P = 0.04 vs. baseline Isc. (C) Isc across monolayers of AT2 cells treated with a fixed dose of adenosine (10−4 M) before and during application of incremental concentrations of amiloride. Data are normalized to maximal Isc for each condition. n = 4 (control) and 5 (adenosine). (D) Iscs in AT2 cells treated with amiloride (10 μM) before application of the indicated concentrations of adenosine. n = 5 filters. Base, baseline current measured after stabilization and before addition of amiloride. ∗, P = 0.001 vs. baseline, ∗∗, P = 0.0.04 vs. amiloride-treated cells; ∗∗∗, P < 0.005 vs. amiloride-treated cells. (E) Effect of CFTR inhibition on Isc in rat AT2 cells. Baseline Isc was measured before addition of amiloride (10−5 M), followed by adenosine (10−5 M) and then CFTRinh-172 (CFTRi, 50 μM) or just CFTRinh-172. Iscs shown were measured after stabilization of Isc. n = 5 filters. ∗, P = 0.05 vs. baseline; ∗∗, P < 0.05 vs. amiloride and CFTRinh-172; ∗∗∗, P < 0.05 vs. all other groups.
Fig. 5.
Fig. 5.
AFC in C57bl6 mice. (A) Adenosine effects on AFC. n = 8 mice per group. ∗, P = 0.03 vs. vehicle-treated controls (Ctl). (B) AFC in mice treated with the A1R agonist CPA (10−6 M, n = 5). ∗, P = 0.001 vs. vehicle-treated controls (Ctl). (C) AFC in the presence of the nonspecific A2 agonist NECA (10−4 M) with and without the A2aR antagonist CSC-caffeine (10−6 M). A2bR function was assessed by using a dose of adenosine that increases AFC (10−8 M) with and without the A2bR antagonist MRS 1706 (10−6 M). n = 8 mice per group. ∗, P < 0.02 vs. vehicle-treated control (Ctl). (D) A3R function was assessed by using the A3R agonist IB-MECA at the doses shown. n = 8 mice per group. ∗, p = 0.001 vs. vehicle-treated controls (Ctl). (E) Alveolar fluid clearance in mice with targeted deletions of the A1R (A1R−/−) in the presence and absence of a dose of adenosine that decreases AFC (10−4 M). n = 8 mice per group. P = 0.04 vs. untreated A1R−/− mice. (F) Effect of Cl transport inhibitors glibenclamide (10−6 M) with bumetinide (10−6 M) (G+B) or CFTRinh-172 (CFTRi,10−6 M) on adenosine (10−4 M) induced reduction of AFC. n = 6 mice. ∗, P = 0.03 vs. controls treated with vehicle only (Ctl). (G). Wet–dry weight ratios of mice treated with the doses of adenosine shown (in 50 μl of 0.9% NaCl, intratracheal) or an equal volume of vehicle (0.9% NaCl) for 30 min (Ctl). The role of CFTR in this model was assessed by instillation of the CFTR inhibitor CFTRinh-172 (CFTRi, 10−6 M) with and without adenosine (10−4 M). n = 4 mice. ∗, P = 0.002 vs. vehicle-treated control (Ctl).

Similar articles

Cited by

References

    1. Ware LB, Matthay MA. Am J Respir Crit Care Med. 2001;163:1376–1383. - PubMed
    1. Olivera W, Ridge K, Sznajder J. Am J Respir Crit Care Med. 1995;152:1229–1234. - PubMed
    1. Saldias FJ, Azzam ZS, Ridge KM, Yeldandi A, Rutschman DH, Schraufnagel D, Sznajder JI. Am J Physiol Lung Cell Mol Physiol. 2001;281:L591–L597. - PubMed
    1. Modelska K, Matthay M, Brown L, Deutch E, Lu L, Pittet J. Am J Physiol Lung Cell Mol Physiol. 1999;276:L844–L857. - PubMed
    1. Chunn JL, Young HW, Banerjee SK, Colasurdo GN, Blackburn MR. J Immunol. 2001;167:4676–4685. - PubMed

Publication types

LinkOut - more resources