. 2007 Mar 6;104(10):4153-8.
doi: 10.1073/pnas.0611723104. Epub 2007 Feb 27.

Cortical area size dictates performance at modality-specific behaviors

Affiliations

Cortical area size dictates performance at modality-specific behaviors

Axel Leingärtner et al. Proc Natl Acad Sci U S A. .

Abstract

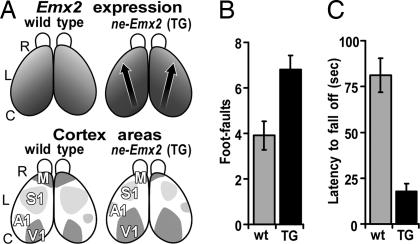
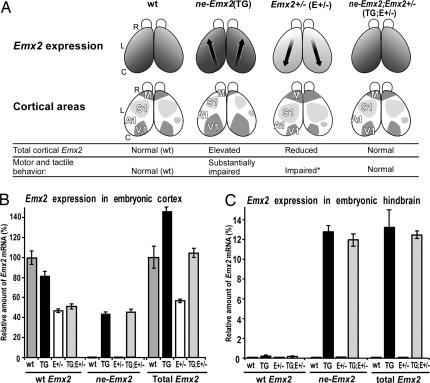
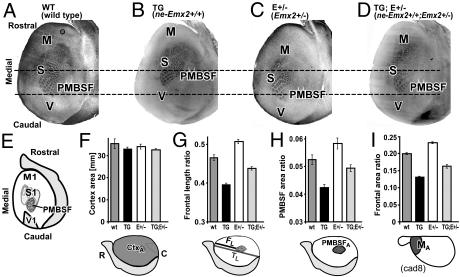
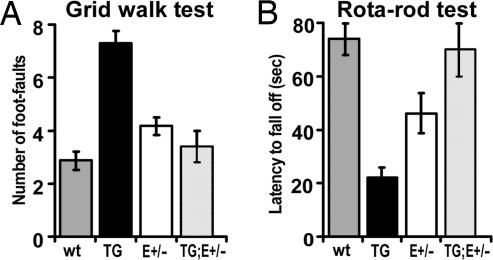
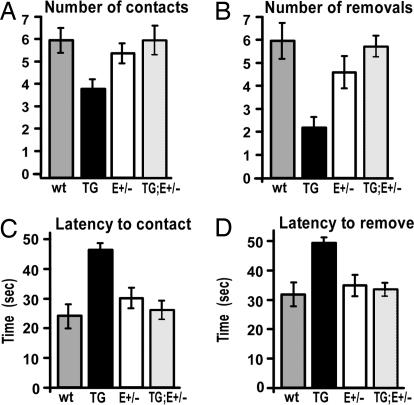
The mammalian neocortex is organized into unique areas that serve functions such as sensory perception and modality-specific behaviors. The sizes of primary cortical areas vary across species, and also within a species, raising the question of whether area size dictates behavioral performance. We show that adult mice genetically engineered to overexpress the transcription factor EMX2 in embryonic cortical progenitor cells, resulting in reductions in sizes of somatosensory and motor areas, exhibit significant deficiencies at tactile and motor behaviors. Even increasing the size of sensorimotor areas by decreasing cortical EMX2 levels can lead to diminished sensorimotor behaviors. Genetic crosses that retain ectopic Emx2 transgene expression subcortically but restore cortical Emx2 expression to wild-type levels also restore cortical areas to wild-type sizes and in parallel restore tactile and motor behaviors to wild-type performance. These findings show that area size can dictate performance at modality-specific behaviors and suggest that areas have an optimal size, influenced by parameters of its neural system, for maximum behavioral performance. This study underscores the importance of establishing during embryonic development appropriate levels of regulatory proteins that determine area sizes, thereby influencing behavior later in life.


Conflict of interest statement

The authors declare no conflict of interest.

Figures

Fig. 1.
Fig. 1.
Reduction in sizes of sensorimotor areas in ne-Emx2 mice correlates with diminished performance on tests of tactile and motor behaviors. (A) Dorsal views of mouse neocortex to show relative levels of graded Emx2 expression and area patterning in wt and ne-Emx2 transgenic (TG) mice. R, rostral; L, lateral; C, caudal. (Upper) Emx2 expression in embryonic cortex. Arrows indicate shifts in area patterning. Darker shading indicates higher Emx2 expression. (Lower) Size and position of primary sensory areas, somatosensory (S1), visual (V1), auditory (A1), and motor area (M), in adult cortex. Compared with wt, M and S1 are reduced in size in ne-Emx2 mice. Overall cortical size is the same as in wt. (B) Grid walk. Mice walk over a wire mesh grid, and performance is analyzed (16). Analysis was done by counting the number of errors in foot placement (foot-faults) per 20 steps. The wt made significantly fewer foot-faults (3.9 ± 0.6, n = 11) than ne-Emx2 (TG) mice (6.8 ± 0.6, n = 11) (Student's t test, P = 0.0034). In addition, ne-Emx2 mice often fall off the grid, a behavior never seen in wt (see SI Movie 1). (C) Rotarod. Mice were placed on a rotating rod that smoothly accelerated from 5 to 70 rpm over 3 min, and the latency to fall off was measured as described (17). ne-Emx2 (TG) mice show a significantly reduced performance (average fall-off latency = 17.8± 4.4 s, n = 11) compared with wt (average fall-off latency = 81.2 ± 9.2 s, n = 11; Student's t test P = 4.29E-06) (see SI Movie 2).
Fig. 2.
Fig. 2.
Rationale of genetic rescue experiments and quantification of Emx2 transcripts. (A) Schematic of rescue rationale. Description similar to Fig. 1A but includes two additional genotypes: Emx2 heterozygous mice (Emx2+/−) and ne-Emx2; Emx2+/− mice, homozygous for the ne-Emx2 transgene and heterozygous for the endogenous Emx2 allele. Relative levels of graded Emx2 expression are shown. In Emx2+/− mice, S1 and M areas are increased in size, whereas in ne-Emx2; Emx2+/− mice, the level of overall cortical Emx2 expression (endogenous and transgene) is similar to wt, and cortical area sizes revert toward wt. Motor and tactile behavioral performances are summarized. Emx2+/− mice show diminished performance in the grid walk and rotarod, albeit to a lesser degree than ne-Emx2 mice, but performance in the adhesive patch test is not statistically different from wt (indicated by an asterisk). (B and C) Emx2 expression level in embryonic day 12.5 embryos, an age of peak Emx2 expression, determined by quantitative real-time PCR. y-coordinate: amount of Emx2 mRNA, normalized to an endogenous reference (GABDH mRNA) and relative to total Emx2 mRNA in embryonic day 12.5 wt cortex. Sources of mRNA: wt, ne-Emx2 (TG), Emx2+/− (E+/−), and ne-Emx; Emx2+/− (TG;E+/−) mice. Levels were determined independently for the mRNA transcribed from the endogenous Emx2 gene (wt Emx2 transcript), from the ne-Emx2 transgene (ne-Emx2 transcript), and for the pooled mRNA derived from both genes (total Emx2 transcripts). (B) Embryonic cortex. Compared with wt, total Emx2 mRNA is increased by 43 ± 3.3% (P = 0.002) in ne-Emx2 mice and reduced to 45 ±1.5% in Emx2+/− mice (P = 0.00006). In ne-Emx2; Emx2+/− (TG;E+/−) mice, total Emx2 mRNA (104 ± 6.9%) is statistically indistinguishable from wt (P = 0.64). (C) In hindbrain [and other subcortical regions, e.g., spinal cord (data not shown)], total Emx2 mRNA in ne-Emx2; Emx2+/− mice (12.44 ± 0.35%) is indistinguishable (P = 0.69) from ne-Emx2 mice (13.21 ± 2.01%). Endogenous Emx2 mRNA is not detectable in hindbrain of wt and Emx2+/− mutant embryos. (Values from three independent experiments, error bars represent ± SEM, P values from unpaired two-tailed Student's t test.)
Fig. 3.
Fig. 3.
Genetic crosses of ne-Emx2 transgenic and Emx2+/− heterozygous mice restore cortical Emx2 expression to wt levels and restore cortical area sizes toward wt sizes. (A–D) Tangential sections through layer 4 of flattened mouse cortices at postnatal day 7, stained for cytochrome oxidase to reveal area patterning landmarks. Sections are from four different genotypes that express different levels of EMX2 encoding transcripts in progenitor cells of the cortex during development (see Fig. 2B). (A) Wild type. (B) ne-Emx2+/+ transgenics. (C) Emx2+/− heterozygotes. (D) ne-Emx2+/+; Emx2+/− double mutants. CO staining patterns reveal differences in sizes and positions of cortical areas between genotypes. Horizontal lines across the sections support visualizing those changes. M, motor cortex; S, somatosensory cortex; PMBSF, posteromedial barrel subfield of somatosensory cortex; V, visual cortex. For a schematic of the area size changes, see Fig. 2A; for quantification, see F–I. (E) Schematic of flattened cortical hemisphere: indicated area landmarks, as revealed by CO and serotonin staining (serotonin sections not shown), were used for the area measurements and quantifications shown in F–I. Gray shaded area marks nonneocortical regions (olfactory bulb, rhinal cortex). (F–I) Histograms of cortical sizes, cortical area ratios, and cortical length ratios at postnatal day 7 of wt, TG (ne-Emx+/+), E+/− (Emx2+/−), and TG;E+/− (ne-Emx+/+; Emx2+/−) mice. Schematics below histograms relate to the schematic in E and indicate the specific measurements performed. (F) Overall surface area of neocortex in millimeters. Overall surface areas are not significantly different from wt (wt: 35.3 ± 2.1, n = 17; TG: 32.9 ± 0.9, n = 13; E+/−: 34.0 ± 1.1, n = 9; TG;E+/−: 32.6 ± 0.7, n = 13). All P values are >0.14 (unpaired Student's t test). (G) Frontal length ratio, defined as the ratio of FL (length between the rostral edge of PMBSF and the rostral pole of neocortex) to TL (total length of neocortex from rostral pole to occipital pole). Compared with wt (n = 13), the frontal ratio is significantly decreased in TG (−15 ± 0.8%∗∗, n = 12), significantly increased in E+/− (+9 ± 1.42%∗∗, n = 8), and reverts toward wt in TG;E+/− (−6 ± 1.17%∗, n= 11). (H) PMBSF area ratio, defined as the ratio of PA (area of PMBSF) to TA (area of the entire neocortex). Compared with wt (n + 8), the PMBSF ratio is significantly decreased in TG (−21 ± 2.3%∗∗, n = 6), significantly increased in E+/− (+11 ± 3.7%∗∗, n = 8), and reverts toward wt in TG;E+/− (−6 ± 2.6%, P = 0.0771; n = 8). (I) Frontal area ratio, defined as the ratio of MA [area covered by the rostral (motor) cad8 expression domain] to TA (area of entire cortex). Compared with wt (n = 6), the size of the rostral motor domain is significantly reduced in TG (−34 ± 1.7%∗∗, n = 9), significantly increased in E+/− (+15 ± 1.5%∗∗, n = 6), and reverts towards wt in TG;E+/− (−18 ± 2.7%∗∗, n = 9). Measurements were performed on whole mounts of cad8 in situ hybridization without flattening of the hemisphere. (Scale bar in A for A–D: 1 mm.) Bars in the histograms represent the means, and error bars represent SEM. Symbols used in this legend indicate the following: %, percent increase or decrease relative to wt; ±, SEM; n, number of cases: ∗, P < 0.05; ∗∗, P < 0.01 (unpaired Student's t tests).
Fig. 4.
Fig. 4.
Sensorimotor behavioral deficiencies in ne-Emx2 mice are rescued by crosses that rescue area sizes but retain full level of subcortical Emx2 transgene expression. Forty adult male mice, ten of each of the four genotypes indicated and littermates from the same breeding group, were analyzed blind for behavioral performance at grid walk (A) and rotarod (B). Tests were done as described in Fig. 1. Mice are from a different breeding group than those tested in Fig. 1. Data were analyzed with unpaired Student's t test and one-way ANOVA followed by post hoc Dunnett's and Fisher (LSD) multiple comparison tests. Mean values with standard errors are presented. (A) Grid walk. The four genotypes performed significantly different (ANOVA, P = 1E-07, F = 26.10, Fcritical = 3.01). The ne-Emx2 mice (TG) (7.3 ± 0.4) made significantly more foot-faults than wt (2.86 ± 0.318) (t test and ANOVA: P < 0.0001). Emx2+/− mice (E+/−) (4.17 ± 0.3) performed worse than wt (t test, P = 0.0156; ANOVA, P = 0.0490). In contrast, ne-Emx2; Emx2+/− rescue mice (TG;E+/−) (3.4 ± 0.6) were indistinguishable from wt (t test, P = 0.46; ANOVA, P = 0.42) and performed significantly better than ne-Emx2 (TG) mice (t test, P = 0.0007; ANOVA, P < 0.0001). (B) Rotarod. Depending on the genotype, animals performed differently at this task (one-way ANOVA, P = 2.69E-05, F = 12.93, Fcritical = 2.99). The ne-Emx2 mice (TG) fell off the rod with an average latency of 21.6 ± 3.28 s, demonstrating a severe impairment in performance compared with wt (73.79 ± 5.38 s) (t test, P < 0.0001; ANOVA, P < 0.0001). Emx2+/− mice (E+/−) (46.25 ± 7.6 s) also performed significantly poorer than wt (t test, P = 0.0160; ANOVA, P = 0.0061). In contrast, ne-Emx2; Emx2+/− rescue mice (TG;E+/−) (69.6 ± 9.91 s) perform as well as wt (t test, P = 0.73; ANOVA, P = 0.66) and significantly better than ne-Emx2 mice (TG) (t test, P = 0.0073; ANOVA, P < 0.0001).
Fig. 5.
Fig. 5.
Genetic rescue of sensorimotor area sizes also rescues deficiencies on a unique sensorimotor behavioral test. The same 40 adult male mice described in Fig. 4 were analyzed at the adhesive removal test (31). Each mouse received four trials; in each trial an adhesive patch was placed on both hind paws, for a total of eight possible contacts and eight possible removals (SI Movie 3). One-way unpaired Student's t test and one-way ANOVA followed by post hoc multiple comparison tests [Dunnett's and Fisher (LSD)] were performed to determine the significance of differences between genotypes. Mean values with standard errors are presented. (A) Number of contacts with the patch. ne-Emx2 mice (TG) are significantly less likely to contact the patch (3.90 ± 0.41 contacts) than wt mice (6.00 ± 0.53 contacts) (t test, P = 0.00920; ANOVA, P = 0.00276). However, ne-Emx2; Emx2+/− (TG;E+/−) rescue mice (6.00 ± 0.63 contacts) perform significantly better than ne-Emx2 mice (TG) (t test, P < 0.0001; ANOVA, P = 0.0082), at a level statistically indistinguishable from wt (t test, P = 1; ANOVA, P = 1). Emx2+/− mice (E+/−) (5.43 ± 0.43 contacts) do not perform significantly different from wt (t test, P = 0.42; ANOVA, P = 0.42). (B) Number of removals. ne-Emx2 mice (TG) are significantly less likely to remove the patch (1.80 ± 0.42 removals) than wt (5.00 ± 0.68 removals) (t test, P = 0.0018; ANOVA, P = 0.0001). However, ne-Emx2; Emx2+/− rescue mice (TG;E+/−) (4.80 ± 0.37 removals) are indistinguishable from wt (t test, P = 0.80; ANOVA, P = 0.82) but significantly different from ne-Emx2 mice (TG) (t test, P = 0.0002; ANOVA, P = 0.0012). Emx2+/− mice (E+/−) (3.86 ± 0.56 removals) did not differ significantly from wt (t test, P = 0.229; ANOVA, P = 0.155). (C) Latency to contact the patch. ne-Emx2 mice (TG) take significantly longer to contact the patch (46.25 ± 2.11 s) than wt (23.94 ± 3.95 s) (t test, P < 0.0001; ANOVA, P < 0.0001). In contrast, ne-Emx2; Emx2+/− rescue mice (TG;E+/−) (26.00 ± 2.93 s) are statistically indistinguishable from wt (t test, P = 0.68; ANOVA, P = 0.68), and significantly different from ne-Emx2 mice (TG) (t test, P = 0.0005; ANOVA, P < 0.0001). Emx2+/− mice (E+/−) (30.29 ± 3.40 s) did not perform significantly different from wt (t test, P = 0.23; ANOVA, P = 0.16). (D) Latency to remove the patch. ne-Emx2 mice (TG) take significantly longer to remove the patch (54.70 ± 1.70 s) than wt (35.25 ± 4.31 s) (t test, P = 0.0005; ANOVA, P < 0.0001), but the ne-Emx2; Emx2+/− rescue mice (TG;E+/−) (37.20 ± 2.60 s) performed identical to wt (t test, P = 0.70; ANOVA, P = 0.71) and significantly different from ne-Emx2 (TG) (t test, P < 0.0001; ANOVA, P = 0.0008). Emx2+/− animals (E+/−) (38.64 ± 4.04 s) were statistically indistinguishable from wt (t test, P = 0.57; ANOVA, P = 0.47).

References

    1. Brodmann K. Allg Z Psychiatr (Berlin) 1918;74:564–568.
    1. Dougherty RF, Koch VM, Brewer AA, Fischer B, Modersitzki J, Wandell BA. J Vis. 2003;3:586–598. - PubMed
    1. Stensaas SS, Eddington DK, Dobelle WH. J Neurosurg. 1974;40:747–755. - PubMed
    1. White LE, Andrews TJ, Hulette C, Richards A, Groelle M, Paydarfar J, Purves D. Cereb Cortex. 1997;7:31–47. - PubMed
    1. White LE, Andrews TJ, Hulette C, Richards A, Groelle M, Paydarfar J, Purves D. Cereb Cortex. 1997;7:18–30. - PubMed

Publication types

LinkOut - more resources