. 2007 Mar 6;104(10):4159-64.
doi: 10.1073/pnas.0611236104. Epub 2007 Feb 27.

Regulation of Alzheimer's disease amyloid-beta formation by casein kinase I

Affiliations

Regulation of Alzheimer's disease amyloid-beta formation by casein kinase I

Marc Flajolet et al. Proc Natl Acad Sci U S A. .

Abstract

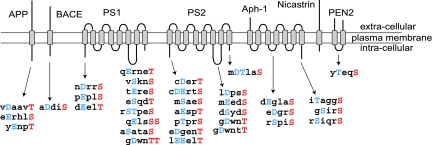
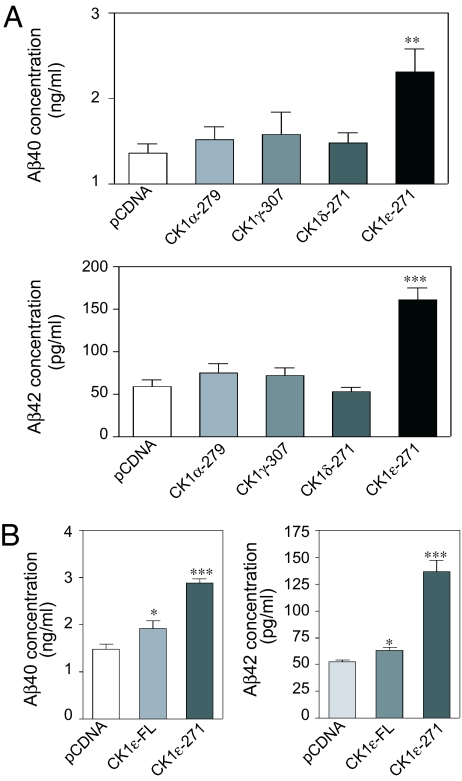
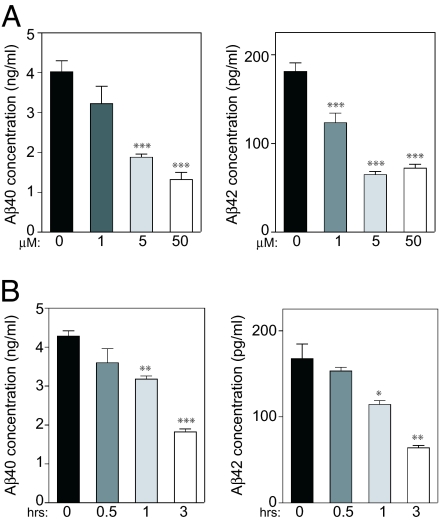
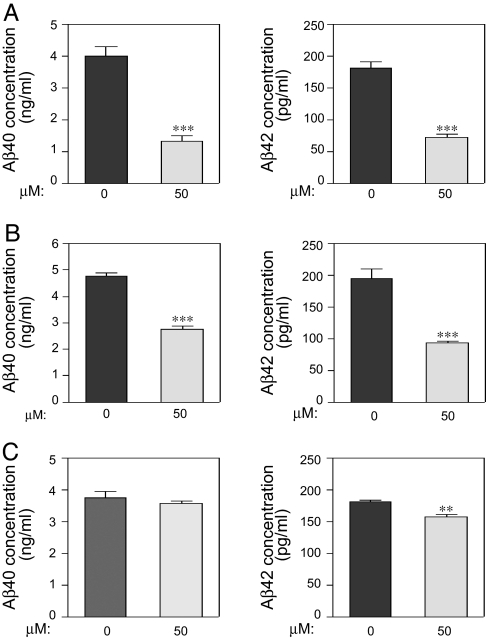
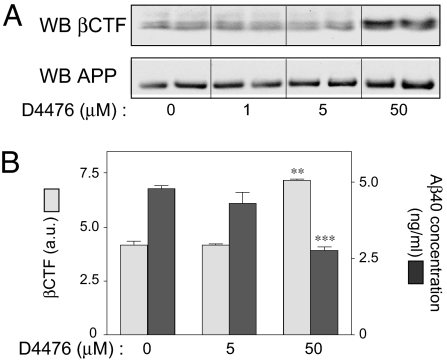
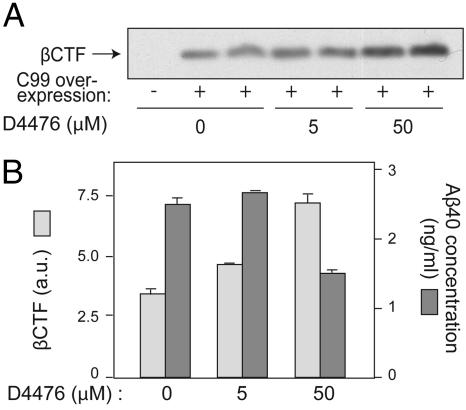
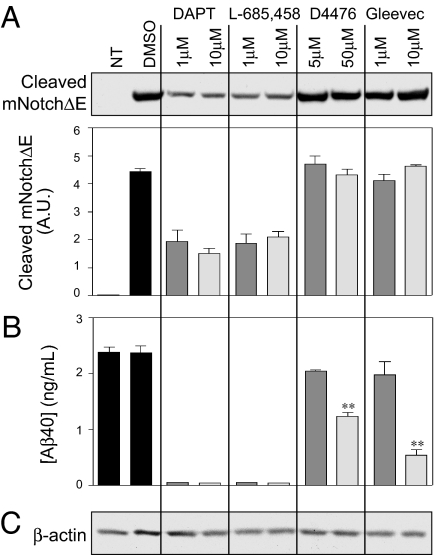
Alzheimer's disease (AD) is associated with accumulation of the neurotoxic peptide amyloid-beta (Abeta), which is produced by sequential cleavage of amyloid precursor protein (APP) by the aspartyl protease beta-secretase and the presenilin-dependent protease gamma-secretase. An increase of casein kinase 1 (CK1) expression has been described in the human AD brain. We show, by using in silico analysis, that APP, beta-secretase, and gamma-secretase subunits contain, in their intracellular regions, multiple CK1 consensus phosphorylation sites, many of which are conserved among human, rat, and mouse species. Overexpression of constitutively active CK1epsilon, one of the CK1 isoforms expressed in brain, leads to an increase in Abeta peptide production. Conversely, three structurally dissimilar CK1-specific inhibitors significantly reduced endogenous Abeta peptide production. By using mammalian cells expressing the beta C-terminal fragment of APP, it was possible to demonstrate that CK1 inhibitors act at the level of gamma-secretase cleavage. Importantly, Notch cleavage was not affected. Our results indicate that CK1 represents a therapeutic target for prevention of Abeta formation in AD.


Conflict of interest statement

The authors declare no conflict of interest.

Figures

Fig. 1.
Fig. 1.
Conservation of CK1 consensus phosphorylation sites in APP, BACE, and γ-secretase. Consensus sites were determined by using different computational tools (ELM-motifs, NetPhos 2.0). Only intracellular regions were considered for this analysis. The amino acid sequences of the consensus phosphorylation sites are listed below the regions of the proteins in which they are found. The sites indicated are conserved in human, rat, and mouse genes. The residue potentially phosphorylated by CK1 (Ser or Thr) is indicated in red, and the acidic residue (Asp/Glu or phosphorylated Ser/Thr) required two or three residues N-terminal is indicated in blue. Transmembrane domains are indicated by gray rectangles.
Fig. 2.
Fig. 2.
Constitutively active CK1ε selectively increases Aβ formation. N2A cells stably expressing APP-695 were transiently transfected with plasmids containing different isoforms of truncated (constitutively active) or full-length (not constitutively active) CK1. Forty-eight hours after transfection, cell supernatants were collected and subjected to Aβ40/Aβ42 sandwich ELISAs. The same amount of plasmid DNA was used for each of the transfections, and the level of expression was verified and normalized by Western blot analysis. (A) Comparison of the capacity of the four constitutively active CK1 isoforms to increase Aβ40 peptide production. The CK1 numbers indicate the last amino acid contained in the different truncation mutants. (B) Comparison of full-length CK1ε (CK1ε-FL) and constitutively active CK1ε (CK1ε-271) to regulate Aβ40/Aβ42 peptide regulation. Data for at least three experiments (mean ± SEM) were compared (GraphPad Prism ver. 4.0, GraphPad Software, San Diego, CA) with the control conditions (pcDNA). ∗, P < 0.05; ∗∗, P < 0.01; ∗∗∗, P < 0.001; one-tailed Student's t test, 95% significance level. pcDNA; empty pcDNA-3.1 plasmid.
Fig. 3.
Fig. 3.
CK1 inhibitor IC261 abolishes CK1ε-271-dependent Aβ40/Aβ42 increase in a dose- and time-dependent manner. N2A cells stably expressing APP-695 were transiently transfected with CK1ε-271. (A) IC261 dose response (3 h). Forty-eight hours after transfection, cells were incubated in the absence or presence of various concentrations of CK1 inhibitor IC261. Cell supernatants were collected after 3 h of incubation and subjected to Aβ40 (Left)/Aβ42 (Right) ELISAs. (B) IC261 time response (50 μM). Forty-eight hours after transfection, CK1 inhibitor IC261 (50 μM) was added. Cell supernatants were collected at different times of incubation and subjected to Aβ40 (Left)/Aβ42 (Right) sandwich ELISAs. Data for at least three experiments (mean ± SEM.) were compared (GraphPad Prism ver. 4.0) with the control conditions (no drug or zero time point). ∗, P < 0.05; ∗∗, P < 0.01; ∗∗∗, P < 0.001; one-tailed Student's t test, 95% significance level.
Fig. 4.
Fig. 4.
Capacity of three different CK1 inhibitors to lower endogenous Aβ peptide production. N2A cells stably expressing APP-695 were incubated for 3 h in the absence or presence of CK1 inhibitors (50 μM). Cell supernatants were collected and subjected to Aβ40/Aβ42 sandwich ELISAs. (A) IC261. (B) D4476. (C) CKI-7. Data for at least three experiments (mean ± SEM) were compared (GraphPad Prism ver. 4.0) with the control conditions (no drug). ∗∗, P < 0.01; ∗∗∗, P <0.001; one-tailed Student's t test, 95% significance level.
Fig. 5.
Fig. 5.
Effect of CK1 inhibitor D4476 on APP, βCTF, and Aβ levels. N2A cells stably expressing APP-695 were incubated for 3 h with the indicated concentrations of D4476. Cellular extracts were subjected to Western blot analysis by using βCTF or APP antibodies or to Aβ40 ELISAs. (A) Western blot analysis of βCTF and APP in one representative experiment carried out in duplicate. (B) Means ± SEM for βCTF and Aβ40 in at least three independent experiments analyzed in duplicate. Data for at least three experiments (mean ± SEM) were compared (GraphPad Prism ver. 4.0) with the control conditions (no drug). ∗∗, P < 0.01; ∗∗∗, P < 0.001; one-tailed Student's t test, 95% significance level.
Fig. 6.
Fig. 6.
Effect of CK1 inhibitor D4476 on APP-C99 and Aβ levels. N2A cells transiently expressing APP-C99 for 24 h were incubated with various concentrations of D4476 for 3 h. Cell lysates were analyzed by Bis·Tris acrylamide gel electrophoresis and Western blotting by using βCTF antibodies (CT695) or by Aβ40 ELISA. (A) Western blot analysis of one representative experiment carried out in duplicate. (B) βCTF Western blot analysis shown in A was quantified by using the program NIH image (ver. 1.63) and is shown as a histogram (light gray bars). The same samples were also subjected to Aβ40 ELISA (dark gray bars). Data for at least three experiments analyzed in duplicate (mean ± SEM) were compared (GraphPad Prism ver. 4.0) with the control condition (no drug). ∗, P < 0.05; ∗∗ P < 0.01; ∗∗∗, P < 0.001; one-tailed Student's t test, 95% significance level.
Fig. 7.
Fig. 7.
CK1 inhibitor D4476 does not inhibit Notch cleavage. N2A cells transiently expressing N-terminally truncated mNotchΔE-myc were incubated with the indicated concentrations of DAPT, L-685,458, D4476, or Gleevec for 3 h. Cell lysates (20 μg) were analyzed by Bis·Tris acrylamide gel electrophoresis and Western blotting by using anti-cleaved Notch (A) and anti-actin antibodies (C), or by Aβ40 ELISA (B). DAPT and L-685,458 are γ-secretase inhibitors known to inhibit βCTF and Notch cleavage; Gleevec is known to inhibit βCTF but not Notch cleavage; D4476 is a CK1 inhibitor. Data for at least three experiments (mean ± SEM) were compared (GraphPad Prism ver. 4.0) with the control condition (no drug). NT, nontransfected. ∗∗, P < 0.01; one-tailed Student's t test, 95% significance level.

References

    1. Yasojima K, Kuret J, DeMaggio AJ, McGeer E, McGeer PL. Brain Res. 2000;865:116–120. - PubMed
    1. Schwab C, DeMaggio AJ, Ghoshal N, Binder LI, Kuret J, McGeer PL. Neurobiol Aging. 2000;21:503–510. - PubMed
    1. Phiel CJ, Wilson CA, Lee VM, Klein PS. Nature. 2003;423:435–439. - PubMed
    1. Meijer L, Flajolet M, Greengard P. Trends Pharmacol Sci. 2004;25:471–480. - PubMed
    1. Liu F, Ma XH, Ule J, Bibb JA, Nishi A, DeMaggio AJ, Yan Z, Nairn AC, Greengard P. Proc Natl Acad Sci USA. 2001;98:11062–11068. - PMC - PubMed

Publication types