. 2007 Mar 6;104(10):4188-93.
doi: 10.1073/pnas.0605864104. Epub 2007 Feb 28.

A coherent neurobiological framework for functional neuroimaging provided by a model integrating compartmentalized energy metabolism

Affiliations

A coherent neurobiological framework for functional neuroimaging provided by a model integrating compartmentalized energy metabolism

Agnès Aubert et al. Proc Natl Acad Sci U S A. .

Abstract

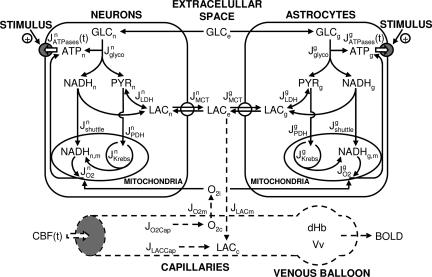
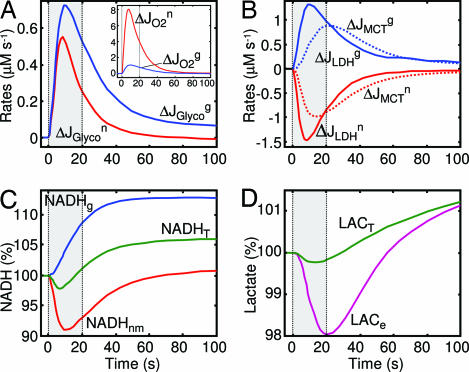
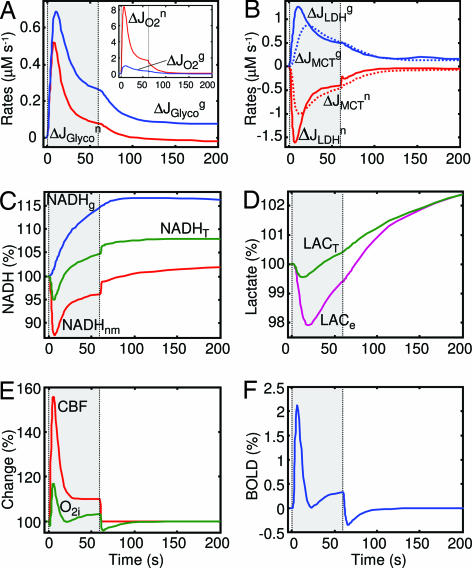
Functional neuroimaging has undergone spectacular developments in recent years. Paradoxically, its neurobiological bases have remained elusive, resulting in an intense debate around the cellular mechanisms taking place upon activation that could contribute to the signals measured. Taking advantage of a modeling approach, we propose here a coherent neurobiological framework that not only explains several in vitro and in vivo observations but also provides a physiological basis to interpret imaging signals. First, based on a model of compartmentalized energy metabolism, we show that complex kinetics of NADH changes observed in vitro can be accounted for by distinct metabolic responses in two cell populations reminiscent of neurons and astrocytes. Second, extended application of the model to an in vivo situation allowed us to reproduce the evolution of intraparenchymal oxygen levels upon activation as measured experimentally without substantially altering the initial parameter values. Finally, applying the same model to functional neuroimaging in humans, we were able to determine that the early negative component of the blood oxygenation level-dependent response recorded with functional MRI, known as the initial dip, critically depends on the oxidative response of neurons, whereas the late aspects of the signal correspond to a combination of responses from cell types with two distinct metabolic profiles that could be neurons and astrocytes. In summary, our results, obtained with such a modeling approach, support the concept that both neuronal and glial metabolic responses form essential components of neuroimaging signals.


Conflict of interest statement

The authors declare no conflict of interest.

Figures

Fig. 1.
Fig. 1.
The proposed model of compartmentalized energy metabolism. This model can describe in vitro situations by including five compartments (solid lines): neuronal cytosol (index n), neuronal mitochondria (index nm), glial or astrocytic cytosol (index g), astrocytic mitochondria (index gm), and extracellular (interstitial) space (index e). To describe in vivo situations, it was necessary to add two more compartments (dashed lines): capillaries (index c) and venous balloon (index v). Stoichiometric coefficients are not displayed.
Fig. 2.
Fig. 2.
Dynamics of the main variables of the model in vitro upon stimulation. Shaded area indicates the stimulation duration (20 s). Red, blue, green, and violet lines relate to neuronal, astrocytic, tissue, and extracellular responses, respectively. Δ refers to deviation from the baseline value. (A) Time courses of the changes in glycolytic fluxes (ΔJGlycog and ΔJGlycon) and oxygen consumption rates (ΔJO2g and ΔJO2n) in astrocytes and neurons. (B) Time courses of the changes in LAC fluxes through MCTs (ΔJMCTg and ΔJMCTn, dotted lines) and LDH-catalyzed reactions (ΔJLDHg and ΔJLDHn) in astrocytes and neurons. (C) Time courses of tissue NADH level (NADHT), cytosolic NADH level in astrocytes (NADHg), and mitochondrial NADH level in neurons (NADHnm), expressed as percent of the baseline value. (D) Time courses of extracellular and tissue LAC levels (LACe and LACT).
Fig. 3.
Fig. 3.
Dynamics of the main variables of the model in vivo upon stimulation. Shaded area indicates the stimulation duration (60 s). (A–D) Red, blue, green, and violet lines relate to neuronal, astrocytic, tissue, and extracellular responses, respectively. Δ refers to deviation from the baseline value. (A) Time courses of the changes in glycolytic fluxes (ΔJGlycog and ΔJGlycon) and oxygen consumption rates (ΔJO2g and ΔJO2n) in astrocytes and neurons, respectively. (B) Time courses of the changes in LAC fluxes through MCTs (ΔJMCTg and ΔJMCTn, dotted lines) and LDH-catalyzed reactions (ΔJLDHg and ΔJLDHn) in astrocytes and neurons, respectively. (C) Time courses of tissue NADH level (NADHT), cytosolic NADH level in astrocytes (NADHg), and mitochondrial NADH level in neurons (NADHnm), expressed as percent of the baseline value. (D) Time courses of extracellular and tissue LAC levels (LACe and LACT, respectively). (E) Time courses of the CBF and the intraparenchymal oxygen (O2i), the latter showing a small initial transient decrease. (F) BOLD fMRI signal.
Fig. 4.
Fig. 4.
Influence of distinct metabolic activations on the BOLD signal in human. Shaded area indicates the duration of the stimulation (40 s). Effect of increasing neuronal (A) or astrocytic (B) stimulation levels on the BOLD signal evolution: Σn and Σg are dimensionless neuronal and astrocytic stimulation parameters, respectively, indicating the relative increases in ATP consumption.

Similar articles

Cited by

References

    1. Raichle ME, Edvinsson L. In: Cerebral Blood Flow and Metabolism. 2nd Ed. Edvinsson L, Krause DN, editors. Philadelphia: Lippincott Williams & Wilkins; 2002. pp. 413–419.
    1. Fox PT, Raichle ME. Proc Natl Acad Sci USA. 1986;83:1140–1144. - PMC - PubMed
    1. Prichard J, Rothman D, Novotny E, Petroff O, Kuwabara T, Avison M, Howseman A, Hanstock C, Shulman R. Proc Natl Acad Sci USA. 1991;88:5829–5831. - PMC - PubMed
    1. Sappey-Marinier D, Calabrese G, Fein G, Hugg JW, Biggins C, Weiner MW. J Cereb Blood Flow Metab. 1992;12:584–592. - PubMed
    1. Frahm J, Krüger G, Merboldt K-D, Kleinschmidt A. Magn Reson Med. 1996;35:143–148. - PubMed

Publication types

LinkOut - more resources