. 2007 Mar 13;104(11):4395-400.
doi: 10.1073/pnas.0700181104. Epub 2007 Mar 7.

Active tissue-specific DNA demethylation conferred by somatic cell nuclei in stable heterokaryons

Affiliations

Active tissue-specific DNA demethylation conferred by somatic cell nuclei in stable heterokaryons

Fan Zhang et al. Proc Natl Acad Sci U S A. .

Abstract

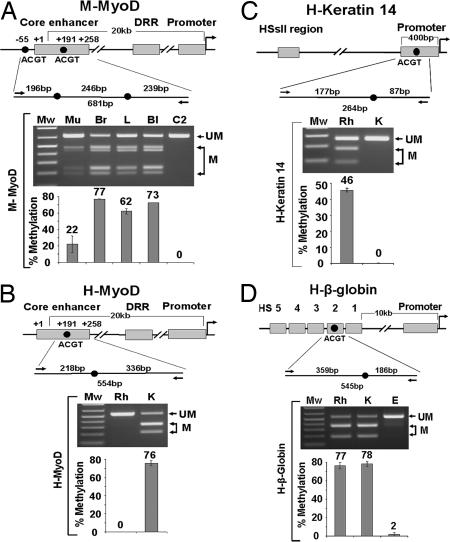
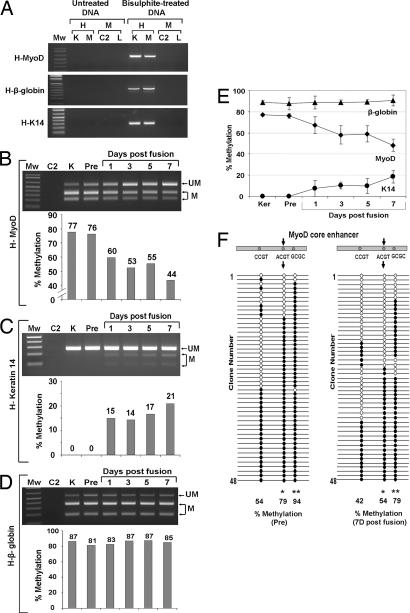
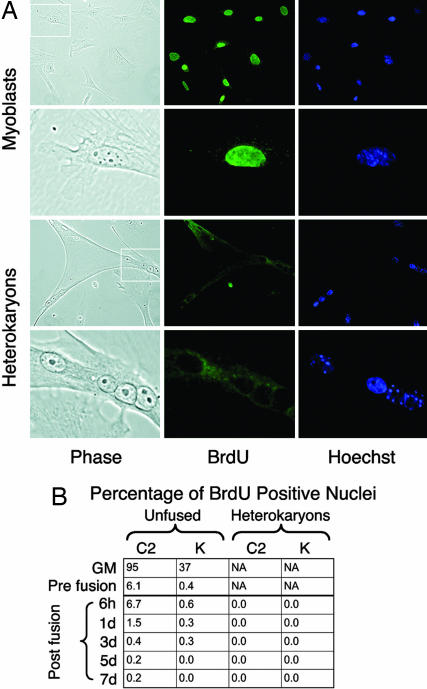
DNA methylation is among the most stable epigenetic marks, ensuring tissue-specific gene expression in a heritable manner throughout development. Here we report that differentiated mesodermal somatic cells can confer tissue-specific changes in DNA methylation on epidermal progenitor cells after fusion in stable multinucleate heterokaryons. Myogenic factors alter regulatory regions of genes in keratinocyte cell nuclei, demethylating and activating a muscle-specific gene and methylating and silencing a keratinocyte-specific gene. Because these changes occur in the absence of DNA replication or cell division, they are mediated by an active mechanism. Thus, the capacity to transfer epigenetic changes to other nuclei is not limited to embryonic stem cells and oocytes but is also a property of highly specialized mammalian somatic cells. These results suggest the possibility of directing the reprogramming of readily available postnatal human progenitor cells toward specific tissue cell types.


Conflict of interest statement

The authors declare no conflict of interest.

Figures

Fig. 1.
Fig. 1.
Reprogramming of gene expression in heterokaryons formed between differentiating murine myoblasts and human primary keratinocytes. (A) Keratinocyte populations uniformly expressing keratin-5 (K-5) were fused with myotubes using PEG, and resulting cultures were grown in low-serum medium supplemented with ara-c and ouabain (K-5, green; Hoechst, blue). Skeletal muscle NCAM is expressed by keratinocyte nuclei only after fusion with muscle cells (NCAM, red). (B) Individual cells are determined to be heterokaryons by the presence of nuclei derived from both human (uniform staining pattern) and mouse (punctate staining pattern) nuclei. (C Lower Left) Frequency of reprogramming is scored as the percentage of individual heterokaryons that express human NCAM. Error bars indicate the standard error of the proportion calculated from the binomial equation. (C Upper) Reprogramming of gene expression over time after fusion is shown. RT-PCR using human-specific primers for MyoD, keratin-14 (K-14), β-globin, and GAPDH. PCR was performed on control samples to test primer specificity and absence of amplification in mouse muscle cells. C2, C2C12 myoblasts; Rh, Rh30 human rhabdomyosarcoma cell line; K, keratinocytes; E, TF-1 human erythroleukemia cell line. (C Lower Right) Time course of gene expression by keratinocyte nuclei before and at daily time points after fusion (MyoD, 35 cycles; K-14, 26 cycles; β-globin, 35 cycles; GAPDH, 29 cycles).
Fig. 2.
Fig. 2.
Analysis of tissue-specific DNA methylation in mouse and human tissues and cell lines. (A–D Top) Schematic drawings of regulatory regions of the genes. (A–D Middle) The regions analyzed, enlarged to show the HpyCH4IV recognition sites (ACGT) examined (black circles), bisulfite-specific primers for PCR (black arrows), and the sizes of HpyCH4IV cleaved PCR products (above the line) and uncleaved PCR products (below the line). (A–D Bottom) COBRA methylation analysis of the ACGT sites of the genes studied: uncleaved and cleaved PCR products visualized by gel electrophoresis (labeled as UM and M, respectively), and the bar graphs showing the percentage of methylation in the corresponding lane above. (A) The mouse MyoD core enhancer. Mu, mouse muscle; Br, brain; L, liver; Bl, blood; C2, C2 myoblasts. (B) The human MyoD core enhancer. (C) The human keratin-14 promoter. (D) The human β-globin HS2 locus. Rh, human rhabdomyosarcoma muscle cells (RH30); K, primary keratinocytes; E, erythroblasts (TF-1 cells).
Fig. 3.
Fig. 3.
Dynamic and gene-specific changes in DNA methylation during nuclear reprogramming. (A) Confirmation of the specificity of bisulfite-specific, human-specific primers: both untreated and bisulfite-treated DNA from human keratinocytes (K), RH30 muscle cells (M), mouse C2 myoblasts (C2), and liver tissue (L) were used, and only bisulfite-treated human DNA showed specific amplification. (B–D) Representative gels of COBRA methylation analysis of keratinocyte DNA during nuclear reprogramming in heterokaryons. (B) MyoD core enhancer. (C) Keratin-14 promoter. (D) β-Globin HS2 locus. Sample order is as follows: differentiating mouse myoblasts (C2), keratinocytes (K), keratinocytes before fusion with C2 (Pre), and heterokaryons cultured for 1, 3, 5, and 7 days after fusion. (E) Average and SD of DNA methylation status of the keratinocyte MyoD core enhancer, keratin-14 promoter, and β-globin HS2 locus in heterokaryons across three independent experiments (see SI Fig. 7). (F) Bisulfite sequencing analysis performed on the keratinocyte MyoD core enhancer: before fusion (Pre) and in heterokaryons cultured for 7 days after fusion. This region contains three CpG sites. Arrows indicate the CpG site analyzed in COBRA assay. Each sample had 48 clones sequenced. The numbers at the bottom indicate the percentage of DNA methylation at each CpG site before and after nuclear reprogramming. ∗, P < 0.01; ∗∗, P < 0.05.
Fig. 4.
Fig. 4.
Assessment of DNA replication in heterokaryon cultures. Cells were labeled with BrdU in the medium, and incorporation was detected by immunofluorescence (green). (A) Representative images of growing myoblasts used as a positive control (upper six images) and heterokaryons (lower six images). In each case the white box indicates the region shown at higher magnification in the three panels below. (Right) Hoechst 33258 was used to label all nuclei. (B) The percentage of BrdU-positive myoblast and human nuclei is shown for various time points. GM indicates cells in growth medium (12 h of BrdU labeling). “Pre fusion” indicates cells in differentiation medium during coculture before PEG (4 h of BrdU labeling). For all other points BrdU was added to the medium at the time of PEG treatment and replaced daily, and cells were fixed and stained at the indicated time points. At each time point, at least 700 nuclei were analyzed.

Similar articles

Cited by

References

    1. Li E. Nat Rev Genet. 2002;3:662–673. - PubMed
    1. Bird A. Genes Dev. 2002;16:6–21. - PubMed
    1. Jones PA, Takai D. Science. 2001;293:1068–1070. - PubMed
    1. Rhind SM, Taylor JE, De Sousa PA, King TJ, McGarry M, Wilmut I. Nat Rev Genet. 2003;4:855–864. - PubMed
    1. Blelloch R, Wang Z, Meissner A, Pollard S, Smith A, Jaenisch R. Stem Cells. 2006;24:2007–2013. - PMC - PubMed

Publication types

LinkOut - more resources