. 2007 Mar 13;104(11):4501-5.
doi: 10.1073/pnas.0607953104. Epub 2007 Mar 5.

Induced mitotic recombination of p53 in vivo

Affiliations

Induced mitotic recombination of p53 in vivo

Wei Wang et al. Proc Natl Acad Sci U S A. .

Abstract

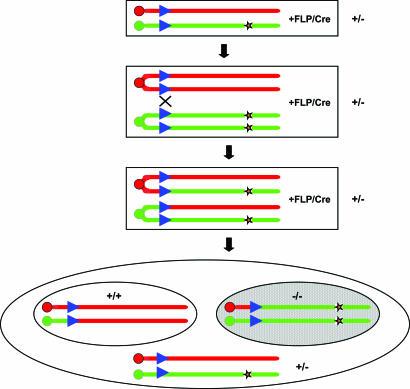
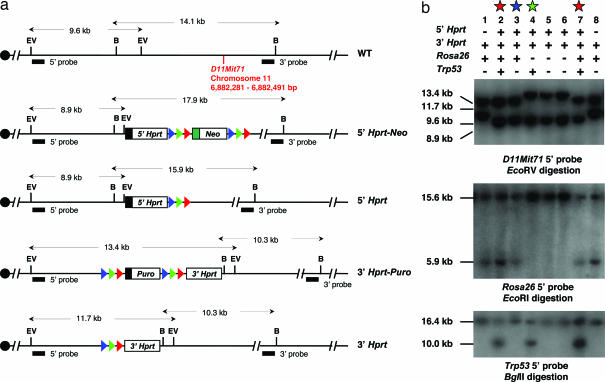
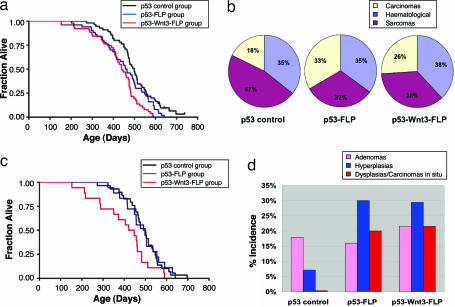
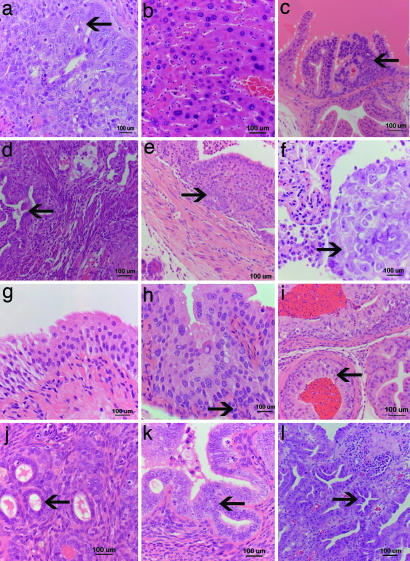
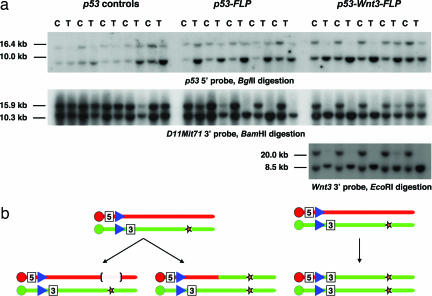
Genetic mosaics produced by FLP/FRT induced mitotic recombination have been widely used in Drosophila to study gene function in development. Recently, the Cre/loxP system has been applied to induce mitotic recombination in mouse embryonic stem cells and in many adult mouse tissues. We have used this strategy to generate a previously undescribed p53 mouse model in which expression of a ubiquitously expressed recombinase in a heterozygous p53 knockout animal produces mitotic recombinant clones homozygous for the p53 mutation. The induction of loss of heterozygosity in a few cells in an otherwise normal tissue mimics genetic aspects of tumorigenesis more closely than existing models and has revealed the possible cell autonomous nature of Wnt3. Our results suggest that inducible mitotic recombination can be used for clonal analysis of mutants in the mouse.


Conflict of interest statement

The authors declare no conflict of interest.

Figures

Fig. 1.
Fig. 1.
Basic strategy for mosaic studies. Mice carrying the mitotic recombination cassettes and a targeted mutation (orange star) are crossed to mice carrying Cre or FLP recombinase to generate mosaic animals. Expression of the recombinase in mice heterozygous for the targeted mutation induces mitotic recombination at G2. Recombinant chromatids follow G2-X segregation and produce cells homozygous for the mutation (shaded area). Blue triangle, FRT/loxP site; red and green bars, homologous chromosomes targeted by the mitotic recombination cassettes.
Fig. 2.
Fig. 2.
Structure of mitotic recombination alleles. (a) Schematic of the D11Mit71 locus in wild-type, 5′ Hprt-Neo and 3′ Hprt-Puro alleles. The Neo and Puro selection markers were removed by Cre or FLP-mediated recombination to generate 5′ Hprt and 3′ Hprt targeted alleles without drug selection markers. Blue triangle, lox5171; green triangle, lox2272; red triangle, FRT site; black box, PGK promoter; green box, PolII promoter; EV, EcoRV; B, BamHI. (b) Southern blot analysis was performed on all of the progeny to identify their genotype at the D11Mit71, Rosa26, and Trp-53 loci (see Experimental Procedures). D11Mit715′Hprt/3′Hprt; Trp-53+/Brdm2; Rosa26+/Fki animals (p53-FLP mice, red star) were examined for the development of tumors. D11Mit715′Hprt/3′Hprt; Trp-53+/Brdm2; Rosa26+/+ mice (p53 controls, green star) were used as a control group for the effect of homozygosity at the D11Mit71 locus on p53 tumorigenesis. D11Mit715′Hprt/3′Hprt; Trp-53+/+; Rosa26+/Fki mice (Hprt control mice, blue star) were used as a control group for the effect of inducible mitotic recombination on tumorigenesis.
Fig. 3.
Fig. 3.
Inducible mitotic recombination accelerates tumor latency and alters tumor spectrum. (a) Kaplan–Meier survival curve analysis of the p53-FLP and p53-Wnt3-FLP mice for all tumors compared with the p53 controls. There is a highly significant difference in survival between p53-Wnt3-FLP mice and p53 controls (P < 0.01). Statistical analysis of the p53-FLP mice vs. p53 controls does not quite reach significance (P = 0.05). The mean survival times of the p53-FLP, p53-Wnt3-FLP, and p53 control mice are 461, 440, and 499 days, respectively. (b) Tumor spectra in p53-FLP and p53-Wnt3-FLP mice compared with p53 controls. There is a reduction in sarcomas and an increase in carcinomas in the p53-FLP and p53-Wnt3-FLP mice. (c) Survival curve analysis of the p53-FLP, p53-Wnt3-FLP, and p53 control mice for sarcomas only. There is a significant reduction in survival in the p53-Wnt3-FLP mice compared with the p53 controls (P = 0.03). The mean survival times of the p53-Wnt3-FLP, p53-FLP, and p53 control mice with sarcomas are 399, 487, and 490 days, respectively. (d) Incidence of benign and premalignant lesions in p53-FLP and p53-Wnt3-FLP mice compared with p53 controls. There is an increase of benign lesions in the p53-FLP and p53-Wnt3-FLP mice. Dysplasias and carcinomas in situ are seen in both the p53-FLP and p53-Wnt3-FLP mice but not the p53 controls.
Fig. 4.
Fig. 4.
Wide spectrum of epithelial lesions induced by mitotic recombination. (a and b) The majority of carcinomas occurring in the p53 control mice were pulmonary adenocarcinomas (a) and hepatocellular carcinomas (b). Mitoses are shown (arrow). (c–f) Carcinomas in the p53-FLP group and the p53-Wnt3-FLP mice also occur in the urogenital and gastrointestinal tract. Mitoses are shown (arrow). For example, prostatic carcinoma (c), uterine endometrial adenocarcinoma in the p53-FLP mice (e), pancreatic duct adenocarcinoma (d), and a rare epithelial mesothelioma of the pleural cavity and pericardium (f) in the p53-Wnt3-FLP mice. (g–l) Premalignant changes (dysplasias) were identified only in the p53-FLP and the p53-Wnt3-FLP mice. Normal bladder urothelium (g); dysplastic bladder urothelium with abnormally large nuclei with irregular chromatin (arrow) found in the p53-FLP mice (h); prostate intraepithelial neoplasia found in the p53-Wnt3-FLP mice; prostatic glands are lined by epithelium with large irregular nuclei and increased mitoses (i); normal endometrium with small tubular endometrial glands (arrow) (j); atypical endometrial hyperplasia with irregularly shaped endometrial glands lined by abnormal epithelium with enlarged elongated nuclei (arrow) found in the p53-Wnt3-FLP mice (k); and gastric intraepithelial dysplasia found in the p53-FLP mice (l). Gastric glands are irregular in shape with enlarged nuclei with irregular chromatin and multiple mitoses (arrow).
Fig. 5.
Fig. 5.
Analysis of LOH. (a) Southern blot analysis of tumor samples from the p53 controls, p53-FLP, and p53-Wnt3-FLP mice. D11Mit71 3′, p53 3′, and Wnt3 3′ probes were used to identify the LOH events in the tumor samples (see Experimental Procedures). Five tumor samples showing LOH of p53 were chosen from each group to check their allelic status at p53, D11Mit71 and Wnt3 loci. C, control samples not showing LOH of p53; T, tumor samples showing LOH of p53. (b) Mechanisms of LOH in the p53 controls, p53-FLP, and p53-Wnt3-FLP mice. The LOH events in the p53 controls occurred by a chromosomal deletion or duplications (Left). However, most LOH events in the p53-FLP and p53-Wnt3-FLP were induced by recombination between the two mitotic recombination cassettes (Right).

Comment in

  • New mouse models of cancer: single-cell knockouts.
    Lozano G, Behringer RR. Lozano G, et al. Proc Natl Acad Sci U S A. 2007 Mar 13;104(11):4245-6. doi: 10.1073/pnas.0700173104. Epub 2007 Mar 5. Proc Natl Acad Sci U S A. 2007. PMID: 17360508 Free PMC article. No abstract available.

References

    1. Austin CP, Battey JF, Bradley A, Bucan M, Capecchi M, Collins FS, Dove WF, Duyk G, Dymecki S, Eppig JT, et al. Nat Genet. 2004;36:921–924. - PMC - PubMed
    1. Hanahan D, Weinberg RA. Cell. 2000;100:57–70. - PubMed
    1. Donehower LA, Harvey M, Slagle BL, McArthur MJ, Montgomery CA, Jr, Butel JS, Bradley A. Nature. 1992;356:215–221. - PubMed
    1. Jacks T, Remington L, Williams BO, Schmitt EM, Halachmi S, Bronson RT, Weinberg RA. Curr Biol. 1994;4:1–7. - PubMed
    1. Purdie CA, Harrison DJ, Peter A, Dobbie L, White S, Howie SE, Salter DM, Bird CC, Wyllie AH, Hooper ML, et al. Oncogene. 1994;9:603–609. - PubMed

Publication types

Substances