. 2007 Mar 13;104(11):4547-52.
doi: 10.1073/pnas.0611732104. Epub 2007 Mar 5.

Importance of culturing primary lymphocytes at physiological oxygen levels

Affiliations

Importance of culturing primary lymphocytes at physiological oxygen levels

Kondala R Atkuri et al. Proc Natl Acad Sci U S A. .

Abstract

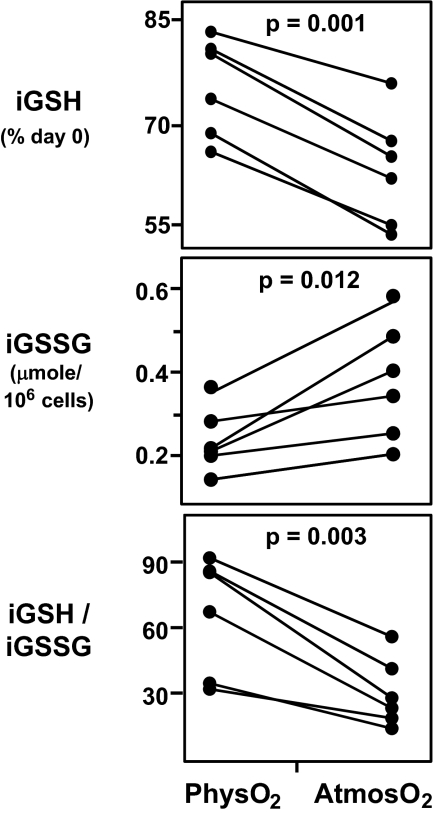
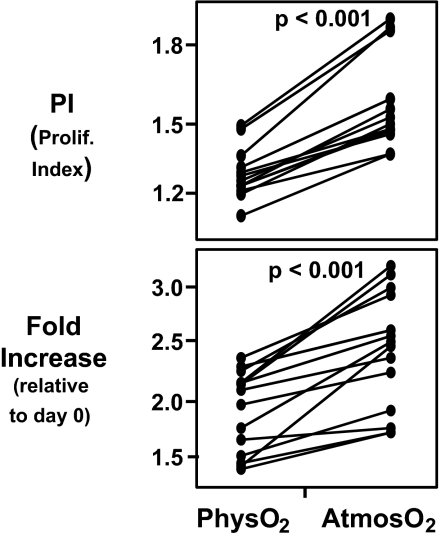
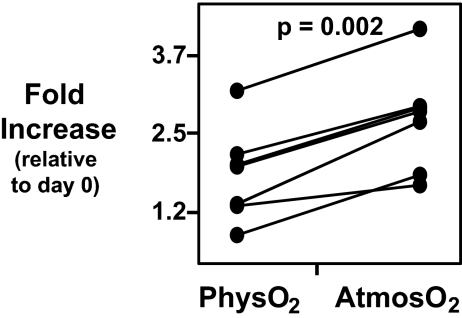
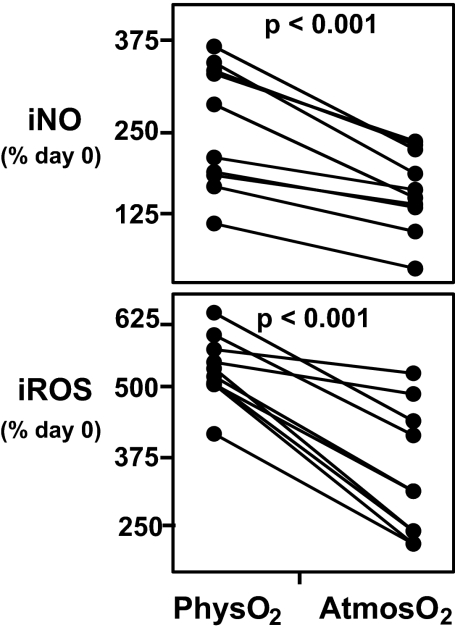
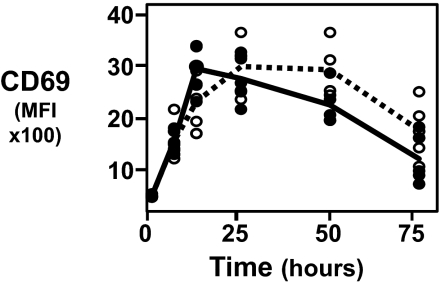
Although studies with primary lymphocytes are almost always conducted in CO(2) incubators maintained at atmospheric oxygen levels (atmosO(2); 20%), the physiological oxygen levels (physO(2); 5%) that cells encounter in vivo are 2-4 times lower. We show here that culturing primary T cells at atmosO(2) significantly alters the intracellular redox state (decreases intracellular glutathione, increases oxidized intracellular glutathione), whereas culturing at physO(2) maintains the intracellular redox environment (intracellular glutathione/oxidized intracellular glutathione) close to its in vivo status. Furthermore, we show that CD3/CD28-induced T cell proliferation (based on proliferation index and cell yield) is higher at atmosO(2) than at physO(2). This apparently paradoxical finding, we suggest, may be explained by two additional findings with CD3/CD28-stimulated T cells: (i) the intracellular NO (iNO) levels are higher at physO(2) than at atmosO(2); and (ii) the peak expression of CD69 is significantly delayed and more sustained at physO(2) that at atmosO(2). Because high levels of intracellular NO and sustained CD69 tend to down-regulate T cell responses in vivo, the lower proliferative T cell responses at physO(2) likely reflect the in vitro operation of the natural in vivo regulatory mechanisms. Thus, we suggest caution in culturing primary lymphocytes at atmosO(2) because the requisite adaptation to nonphysiological oxygen levels may seriously skew T cell responses, particularly after several days in culture.


Conflict of interest statement

The authors declare no conflict of interest.

Figures

Fig. 1.
Fig. 1.
PhysO2 maintain the intracellular redox state closer to in vivo levels than atmosO2. Freshly prepared negatively enriched human peripheral blood T cells (see Materials and Methods) were cultured at physO2 and atmosO2 oxygen for 3 days without exogenous stimulation. iGSH and iGSSG were measured by tandem MS at the beginning and on day 3 of culture. (Top) iGSH levels on day 3 expressed as percentage of iGSH on day 0. (Middle) iGSSG levels on day 3. (Bottom) Intracellular redox state (iGSH/iGSSG) on day 3. Statistics were calculated by using JMP software by least-square fit model with sample and oxygen as independent variables (see Materials and Methods). Each set of connected points represents one subject (n = 6).
Fig. 2.
Fig. 2.
iGSH and iNO levels at physO2 are maintained closer to the in vivo levels compared with atmosO2. Freshly prepared human PBMCs were cultured for 3 days at physO2 and atmosO2 without exogenous stimulation. iGSH and iNO were measured at the beginning and the end of the 3-day culture by FACS (see Materials and Methods). (Upper) CD4 T cell iGSH on day 3 expressed as fraction of iGSH on day 0 (percentage of day 0 iGSH). (Lower) CD4 T cell iNO on day 3 expressed as fraction of iNO on day 0 (percentage of day 0 iNO). Statistics were calculated by using JMP software by least-square fit model with sample and oxygen as independent variables (see Materials and Methods). Each set of connected points represents one subject. n = 16 for iGSH and n = 10 for iNO.
Fig. 3.
Fig. 3.
CD3/CD28-stimulated T cell proliferation is higher at atmosO2 than physO2. CFSE-stained human PBMCs were stimulated for 3 days with plate-bound CD3 (1 μg/ml) and CD28 (2 μg/ml). Cell counts were performed by using BD Trucount tubes. Proliferative index (PI) and fold change in the live CD4 T cell number was calculated as described in Materials and Methods. (Upper) Higher proliferation index (1.63 ± 0.17 at atmosO2 versus 1.32 ± 0.09 at physO2). (Lower) Significantly higher fold increase (2.34 ± 0.69 versus 1.47 ± 0.52) in CD4 T cells stimulated at atmosO2 vs. physO2. Statistics were calculated by using JMP software by least-square fit model with sample and oxygen as independent variables. Each set of connected points represents one subject (n = 16).
Fig. 4.
Fig. 4.
NAC does not abrogate the difference in CD3/CD28-stimulated T cell proliferation at atmosO2 and physO2. CFSE-stained human PBMCs were stimulated with plate-bound CD3 (1 μg/ml) and CD28 (2 μg/ml) for 3 days in cultures supplemented with 1 mM NAC. Cell counts were performed by using BD Trucount tubes. Fold increase in CD4 T cells was calculated as described in Materials and Methods. Statistics were calculated by using JMP software by least-square fit model with sample and oxygen as independent variables. Each set of connected points represents one subject (n = 6).
Fig. 5.
Fig. 5.
CD3/CD28 stimulation-induced increase in iNO and iROS is higher at physO2. Human PBMCs were stimulated with CD3/CD28 for 3 days. iNO and iROS were measured at the beginning and the end of culture by FACS as described in Materials and Methods. (Upper) Percentage increase in iNO (percentage increase relative to day 0). (Lower) Increase in iROS (percentage increase relative to day 0) in CD3/CD28-stimulated CD4 T cells. Statistics were calculated by using JMP software by least-square fit model with sample and oxygen as independent variables. Each set of connected points represents one subject (n = 11).
Fig. 6.
Fig. 6.
Peak expression of CD69 is delayed and more sustained at physO2 than atmosO2. Human PBMCs were stimulated with plate-bound CD3 (1 μg/ml) and CD28 (2 μg/ml) for 3 days. Aliquots of cells were stained for CD69 at 6, 12, 24, 48, and 72 h of stimulation. Median fluorescence intensity (MFI) of CD69 for each sample is plotted against time of stimulation in culture at atmosO2 or physO2. Closed circles (fitted by solid line) represent the kinetics of CD69 expression at atmosO2. Open circles (fitted by broken line) represent the kinetics of CD69 expression at physO2 (n = 6).

References

    1. Campbell JA. J Physiol. 1925;60:20–29. - PMC - PubMed
    1. Laser H. Biochem J. 1937;31:1671–1676. - PMC - PubMed
    1. Caldwell CC, Kojima H, Lukashev D, Armstrong J, Farber M, Apasov SG, Sitkovsky MV. J Immunol. 2001;167:6140–6149. - PubMed
    1. Laser H. Proc R Soc London Ser B. 1952;140:230–243. - PubMed
    1. Haddad H, Windgassen D, Ramsborg CG, Paredes CJ, Papoutsakis ET. Biotechnol Bioeng. 2004;87:437–450. - PubMed

Publication types

LinkOut - more resources