

The metabolic signature related to high plant growth rate in Arabidopsis thaliana
- PMID: 17360597
- PMCID: PMC1810331
- DOI: 10.1073/pnas.0609709104
The metabolic signature related to high plant growth rate in Arabidopsis thaliana
Abstract
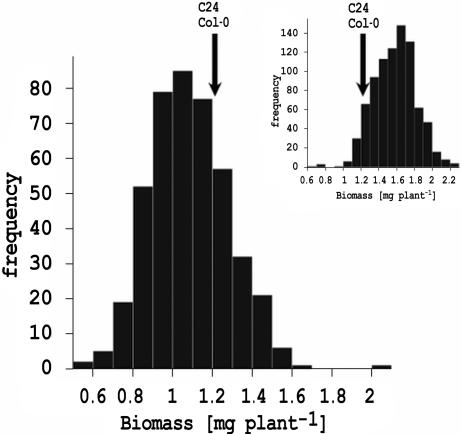
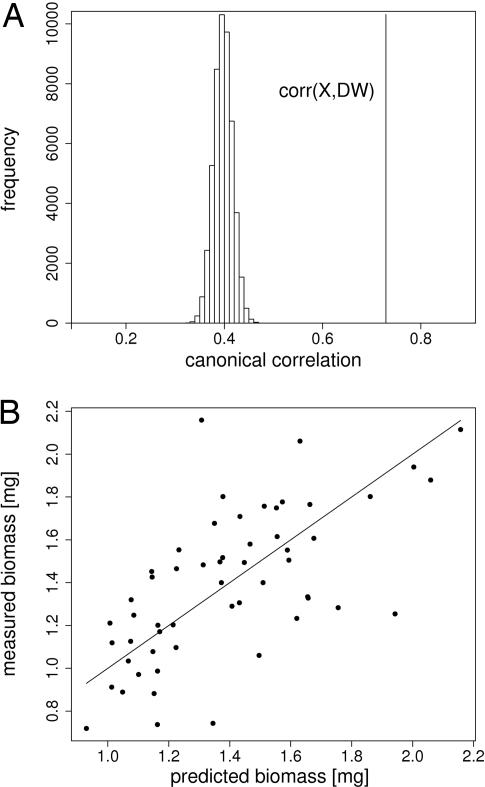
The decline of available fossil fuel reserves has triggered world-wide efforts to develop alternative energy sources based on plant biomass. Detailed knowledge of the relations of metabolism and biomass accumulation can be expected to yield powerful novel tools to accelerate and enhance energy plant breeding programs. We used metabolic profiling in the model Arabidopsis to study the relation between biomass and metabolic composition using a recombinant inbred line (RIL) population. A highly significant canonical correlation (0.73) was observed, revealing a close link between biomass and a specific combination of metabolites. Dividing the entire data set into training and test sets resulted in a median correlation between predicted and true biomass of 0.58. The demonstrated high predictive power of metabolic composition for biomass features this composite measure as an excellent biomarker and opens new opportunities to enhance plant breeding specifically in the context of renewable resources.
Conflict of interest statement
The authors declare no conflict of interest.
Figures
References
-
- Tonsor SJ, Alonso-Blanco C, Koornneef M. Plant Cell Environ. 2005;28:2–20.
-
- Chen S, Hajirezaei M, Peisker M, Tschiersch H, Sonnewald U, Börnke F. Planta. 2005;221:479–492. - PubMed
-
- Fernie AR, Tauberger E, Lytovchenko A, Roessner U, Willmitzer L, Trethewey RN. Planta. 2002;214:510–520. - PubMed
-
- Achard P, Cheng H, De Grauwe L, Decat J, Schoutteten H, Moritz T, Van der Straeten D, Peng JR, Harberd NP. Science. 2006;311:91–94. - PubMed
Publication types
MeSH terms
Substances
LinkOut - more resources
Full Text Sources
Other Literature Sources
