. 2007 Feb 27;104(9):3183-8.
doi: 10.1073/pnas.0611678104. Epub 2007 Feb 20.

Growth of novel protein structural data

Affiliations

Growth of novel protein structural data

Michael Levitt. Proc Natl Acad Sci U S A. .

Abstract

Contrary to popular assumption, the rate of growth of structural data has slowed, and the Protein Data Bank (PDB) has not been growing exponentially since 1995. Reaching such a dramatic conclusion requires careful measurement of growth of novel structures, which can be achieved by clustering entry sequences, or by using a novel index to down-weight entries with a higher number of sequence neighbors. These measures agree, and growth rates are very similar for entire PDB files, clusters, and weighted chains. The overall sizes of Structural Classification of Proteins (SCOP) categories (number of families, superfamilies, and folds) appear to be directly proportional to the number of deposited PDB files. Using our weighted chain count, which is most correlated to the change in the size of each SCOP category in any time period, shows that the rate of increase of SCOP categories is actually slowing down. This enables the final size of each of these SCOP categories to be predicted without examining or comparing protein structures. In the last 3 years, structures solved by structural genomics (SG) initiatives, especially the United States National Institutes of Health Protein Structure Initiative, have begun to redress the slowing growth of the PDB. Structures solved by SG are 3.8 times less sequence-redundant than typical PDB structures. Since mid-2004, SG programs have contributed half the novel structures measured by weighted chain counts. Our analysis does not rely on visual inspection of coordinate sets: it is done automatically, providing an accurate, up-to-date measure of the growth of novel protein structural data.


Conflict of interest statement

The author declares no conflict of interest.

Figures

Fig. 1.
Fig. 1.
The number of clusters, NCID (olive) and NCasID (include asymmetrical links (light green), drops with %ID. The weighted chain count, NWID (magenta), has a very similar dependence on the %ID. All measures depend nonlinearly on the %ID but can be fitted well by a fifth order polynomial that passes through the point (0, 1); at 0% ID, there is 1 cluster and the total weighted chain count is 1. When asymmetrical links are included, the agreement with NWID is less good and these links are generally excluded. Both NCID and NCasID depend linearly on NWID, with NCasID = 0.954NWID − 225 and NCID = 0.974NWID + 421 (Inset).
Fig. 2.
Fig. 2.
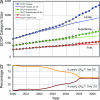
Structural data growth since the inception of the PDB. (a) Growth of protein structural data deposited in the PDB since its inception in 1972. The average growth rate is 28.0% per year for PDB files (NPDB; gray) and 28.4% for nonidentical chains (NCHA; brown). Clustering or down-weighting sequence redundancy at the 25% identity level gives a lower growth rate, very similar for three measures: 24.4% for clustered chains (NC25; olive), 23.0% for weighted chains (NW25; magenta), and 23.4% for number of weighted residues (MW25; lavender; divided by 183, the average number of residues in a PDB chain today). These growth rates are extremely rapid, with a doubling of the data in less than three and a half years (22.5% annual growth rate). The growth as predicted by the Dickerson equation (18) is shown as a dashed blue line. Small differences are masked on the log scale used for the y axis. Thus, NPDB and NCHA seem very similar, but NCHA = 1.12 × NPDB. The novelty ratio (ΔNW25NCHA; orange) is measured on the right-hand axis scale. (b) The annual growth rate smoothed over the previous four quarters fluctuates greatly. Each of the three growth rates, g[NPDB] (gray), g[NC25] (olive), and g[NW25] (magenta), has three peaks. After 1995, there is a steady decline in rate of growth approximated by the green line (see text). Today (August 2006), all three growth rates are half their values in 1995. For exponential growth, the rates should be constant at 22.0%: this is clearly not the case. Growth using deposit dates is complicated by PDB files that are on hold. The coordinates and often the sequences of these entries are not available until their release date. Thus, for a fixed deposit date cutoff, the number of PDB files that can be analyzed (sequence is needed) changes with time until the entries have all been released. This makes the most recent data incomplete. We study this effect by including the on-hold files and recalculating the growth rate of PDB files. This increases the growth rate of the most recent entries (last 2 years in b Inset), but the effect is small reducing the growth rate by 4.4%, 3.7%, 2.5%, 1.8%, 0.8%, and 0.2% points as one goes back six quarters from October 2006. This problem does not occur with release dates [supporting information (SI) Fig. 7b Inset].
Fig. 3.
Fig. 3.
Sizes of SCOP categories depend on number of weighted chains and number of PDB files. (a) Sizes of the SCOP categories (families in blue, superfamilies in green, and folds in red) vary linearly (correlation >0.998) with the number of files released in the PDB (NPDB). Large circles show the historical data for sizes from 13 releases of SCOP since October 1997 (see http://scop.mrc-lmb.cam.ac.uk/scop/count.html). The plot of NW25 vs. NPDB bends upwards (magenta). (b) Variation of the sizes of the three SCOP categories with weighted chain count at 25% identity, NW25. The curves for the real data (blue, green, and red) bend downwards and are well fitted (small black diamonds) by a saturating function N = α × NW25/(1 + α × NW25/Nmax), where α is a scale factor and Nmax is the asymptotic saturation value, the maximum possible number. We find (α, Nmax) = (0.707, 11811), (0.517, 3412), and (0.356, 1613) for families, superfamilies, and folds, respectively. Large diamonds are an extrapolation to the current PDB.
Fig. 4.
Fig. 4.
Growth of sizes of SCOP categories with and without structural genomic data since 2000. (a) Influence of the worldwide SG initiative on the growth of protein structural data. With the SG data, growth is more rapid but even this growth rate has fallen recently (Fig. 2b). The white dots show the real SCOP count before October 2004; the solid lines and filled circles show estimates of the growth of families, superfamilies, and folds from the growth in NW25 or NW(SG−)25. Release dates are used here. (b) Percentage of nonredundant sequence data (NW25) in PDB files deposited in the preceding year that comes or does not come from SG. Before the year 2000, almost all data were unrelated to SG projects; since 2004, almost half the data have come from SG.

References

    1. Kendrew JC, Dickerson RE, Strandberg BE, Hart RG, Davies DR, Phillips DC, Shore VC. Nature. 1961;185:422–427. - PubMed
    1. Kendrew JC. Sci Am. 1961;205:96–111. - PubMed
    1. Levitt M, Chothia C. Nature. 1976;261:552–558. - PubMed
    1. Andreeva A, Howorth D, Brenner SE, Hubbard TJP, Chothia C, Murzin AG. Nucl Acids Res. 2004;32:D226–D229. - PMC - PubMed
    1. Bernstein FC, Koetzle TF, Williams GJ, Meyer EF, Jr, Brice MD, Rodgers JR, Kennard O, Shimanouchi T, Tasumi M. Eur J Biochem. 1977;80:319–324. - PubMed

Publication types

LinkOut - more resources