Comparative Study
. 2007 Feb 27;104(9):3189-94.
doi: 10.1073/pnas.0611419104. Epub 2007 Feb 20.

Mitotic retention of gene expression patterns by the cell fate-determining transcription factor Runx2

Affiliations
Comparative Study

Mitotic retention of gene expression patterns by the cell fate-determining transcription factor Runx2

Daniel W Young et al. Proc Natl Acad Sci U S A. .

Abstract

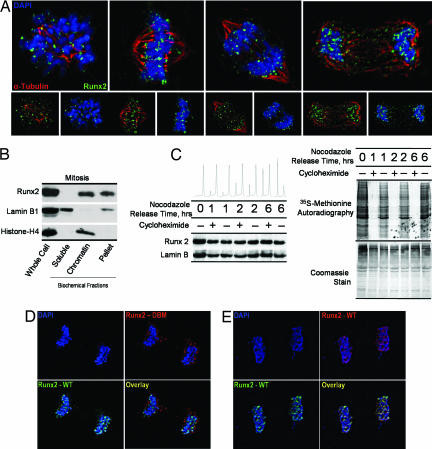
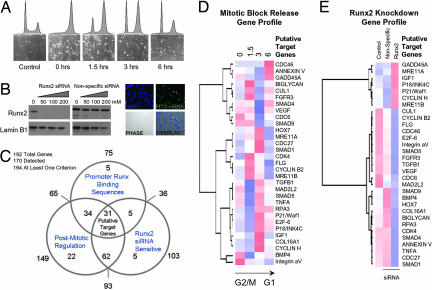
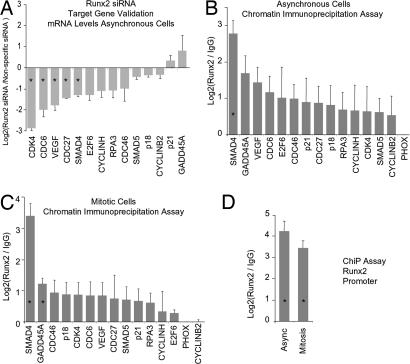
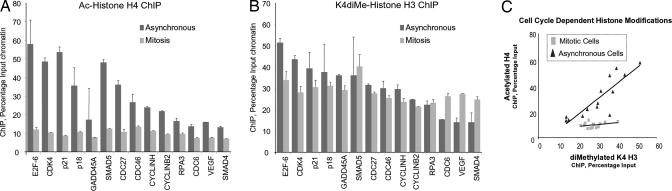
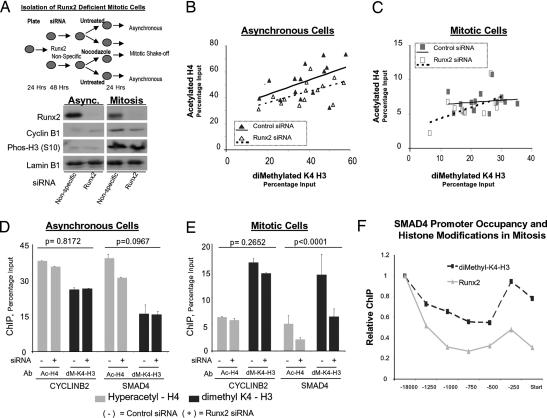
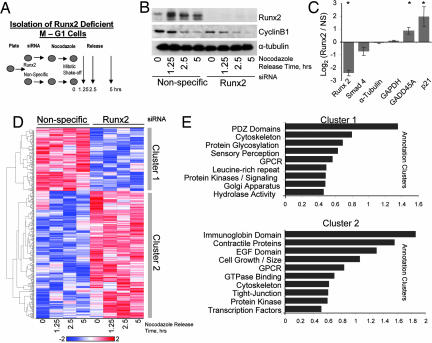
During cell division, cessation of transcription is coupled with mitotic chromosome condensation. A fundamental biological question is how gene expression patterns are retained during mitosis to ensure the phenotype of progeny cells. We suggest that cell fate-determining transcription factors provide an epigenetic mechanism for the retention of gene expression patterns during cell division. Runx proteins are lineage-specific transcription factors that are essential for hematopoietic, neuronal, gastrointestinal, and osteogenic cell fates. Here we show that Runx2 protein is stable during cell division and remains associated with chromosomes during mitosis through sequence-specific DNA binding. Using siRNA-mediated silencing, mitotic cell synchronization, and expression profiling, we identify Runx2-regulated genes that are modulated postmitotically. Novel target genes involved in cell growth and differentiation were validated by chromatin immunoprecipitation. Importantly, we find that during mitosis, when transcription is shut down, Runx2 selectively occupies target gene promoters, and Runx2 deficiency alters mitotic histone modifications. We conclude that Runx proteins have an active role in retaining phenotype during cell division to support lineage-specific control of gene expression in progeny cells.


Conflict of interest statement

The authors declare no conflict of interest.

Figures

Fig. 1.
Fig. 1.
Runx2 is stable and associated with chromosomes during mitosis. (A) Asynchronously growing Saos-2 cells were fixed and stained for DNA by using DAPI and for Runx2 by using a rabbit polyclonal antibody. Mitotic cells were identified by chromosome morphology. High-resolution images obtained by three-dimensional deconvolution algorithms reveal that Runx2 (green) is localized in mitotic chromosomes. A subset of Runx2 colocalizes with the microtubules, labeled by α-tubulin staining (red). (B) Localization of Runx2 by biochemical fractionation using standard techniques to generate soluble, chromatin-associated, and insoluble protein fractions compared with whole-cell protein levels. Each fraction was analyzed by Western blotting using antibodies against Runx2, as well as lamin B1 and histone H4 as controls. (C) Stability of Runx2 protein in mitosis. Saos cells were arrested at the G2/M boundary by nocodazole treatment and released through mitosis into G1 in the presence or absence of the protein translation inhibitor cycloheximide (50 μg/ml). At the indicated times, protein synthesis was assayed by pulse labeling with [35S]methionine. In parallel, protein samples were isolated for Western blot analysis. (D and E) Colocalization studies of wild-type Runx2 and a DNA-binding mutant Runx2. HeLa cells were cotransfected with wild-type Runx2 and the R182Q mutant Runx2 (GenBank accession no. D14637), which were N-terminally tagged with HA and Xpress epitopes, respectively. In situ immunofluorescence microscopy was performed with DNA staining by DAPI and indirect immunolabeling with antibodies directed against HA and Xpress epitopes with appropriate secondary antibodies. Mitotic cells were identified by DNA morphology. Control colocalization experiments were performed by using HA- and Xpress-tagged wild-type proteins.
Fig. 2.
Fig. 2.
Runx2 target gene identification. To identify mitotic target genes of Runx2, we applied a functional genomics strategy. Genes were selected that exhibit alterations in steady-state mRNA during progress from mitosis into G1, that are sensitive to Runx2 siRNA, and that have promoters with Runx consensus motifs. The first two criteria were assessed by cDNA array-based gene profiling (SuperArray Bioscience Corporation), and the final criterion was assessed through a bioinformatics analysis by using TFSEARCH (48). (A) Mitotic cells were released into G1, and RNA was taken at 0, 1.5, 3, and 6 h for analysis. (B) siRNA knockdown of Runx2 was monitored by Western blot analysis at concentrations of 50, 100, and 200 nM. Fluorophore-conjugated siRNA oligonucleotides were transfected in parallel to determine transfection efficiency. Micrographs show localization of siRNA oligonucleotides in cells with ≈95% efficiency at 100 nM. (C) Venn diagram indicates the number of genes in each of the three functional groups. Thirty-one target genes satisfying all three criteria were analyzed by hierarchical clustering based on cell cycle expression data (D) and expression in the Runx2-knockdown experiment (E) (see SI Data Set 1 for primer information). Color maps are applied to standardized gene expression data: pure blue, −3; pure white, 0; and pure red, 3.
Fig. 3.
Fig. 3.
Target gene validation. (A) Fourteen putative Runx2 target genes identified in a primary screen (see Fig. 2) were tested for responsiveness to depletion of Runx2 by RNA interference. Independent siRNA experiments were analyzed in duplicate by RT-qPCR with primer sets for each of the target genes (SI Data Set 1). Expression data are normalized and displayed as the log2 difference between Runx2 and nonspecific siRNAs. Error bars reflect SEM. (B) Runx2 target genes were validated by ChIP in two independent experiments (SI Data Set 1). Samples were quantified by qPCR relative to input and normalized to nonspecific immunoprecipitation of the PHOX gene promoter. Values represent the log2 difference between Runx2-specific and control IgG signals. (C) Interaction of Runx2 with its novel target genes during mitosis was assessed by ChIP assays. Mitotic cells were isolated by nocodazole synchronization and mitotic shakeoff in two independent experiments, and samples were assayed in duplicate by qPCR. Data analysis is described in B. (D) Interaction of Runx2 with its promoter was assessed by ChIP on asynchronous and mitotic cells. Asterisks indicate statistical significance at the 0.05 level based on a t test.
Fig. 4.
Fig. 4.
Runx2 is associated with epigenetically modified target genes in mitosis. Histone modifications at the 14 target genes were assayed by ChIP analyses of asynchronous (dark gray bars) and pure mitotic cells (light gray bars) synchronized as described in Fig. 3. Duplicate samples were analyzed by qPCR, quantified as a percentage of input, and normalized for comparison with subsequent functional experiments in Fig. 5. (A) Histone H4 acetylation and (B) histone H3–K4 dimethylation of gene promoters. (C) Scatterplot of H4 acetylation (ordinate) versus H3–K4 dimethylation (abscissa) for all 14 genes in asynchronous cells (black triangles) and mitotic cells (gray squares) is depicted. A least-squares regression line is shown for each population.
Fig. 5.
Fig. 5.
Runx2 affects mitotic histone modifications at target gene promoters. The effects of Runx2 on promoter histone modifications were assessed by combining siRNA gene knockdown with mitotic cell synchronization. (A) Experimental strategy to obtain Runx2-depleted mitotic cells. Histone modification levels at target gene promoters in mitotic and asynchronous cells were assayed by ChIP and analyzed by qPCR. Protein was extracted from parallel plates to validate Runx2 knockdown. Cyclin B1 levels and histone H3 (S10) phosphorylation status serve as markers of mitosis and lamin B1 as a loading control. Efficiency of siRNA transfection (>90%) was determined in parallel (data not shown). (B and C) Levels of hyperacetylated histone H4 and dimethylated histone H3 (K4) in control and Runx2 siRNA-treated cells were determined in two ChIP assays, each analyzed in duplicate by qPCR. Scatterplot of H4 acetylation versus H3 K4-dimethylation is shown for all 14 target genes in asynchronous (B) and mitotic cells (C) treated with control (black symbols) or Runx2 siRNA (open symbols). A least-squares regression line is shown for each population: control (solid line) or Runx2 siRNA (broken line). (D and E) A mixed-model ANOVA was used to assess significance of Runx2 siRNA effects for all target genes. Multiple pairwise comparisons (Tukey's HSD) were evaluated to determine which effects differ at a 0.05 level and to establish P values; error bars are SE (n = 4). Plots show ChIP results for SMAD4 and CYCLINB2 in Runx2 and control siRNA-treated asynchronous (D) and mitotic cells (E). (F) Binding of Runx2 across the SMAD4 promoter was compared with dimethyl-K4 histone H3 modifications. Primer sets encompassed positions in the proximal and distal SMAD4 promoter, as well as the transcription start site (see SI Data Set 1). Within-group (Runx2 or K4–H3 dimethylated) ratios as calculated in D and E are plotted.
Fig. 6.
Fig. 6.
Genome-wide identification of Runx2-sensitive gene expression patterns during the mitosis to G1 transition. (A) Runx2 and control siRNA-treated cells were synchronized by nocodazole and mitotic shakeoff. Mitotic cells were isolated at shakeoff (0 h), and remaining cells were replated and released for progression into G1 (1.25, 2.5, and 5 h). (B) Total cellular protein was isolated for Western blot analysis to confirm Runx2 knockdown by siRNA. Cyclin B1 levels confirm release from mitosis. (C) Time-averaged expression of Runx2 and target genes detected on Affymetrix microarrays. Asterisks indicate significance at the 0.05 level. (D) Using an empirical Bayes linear modeling approach, we identified 500 genes significantly altered by siRNA treatment. A heat map illustrating hierarchical cluster analysis is shown. Two main clusters reflect genes that are repressed (Cluster 1) and activated (Cluster 2) by Runx2 knockdown. (E) Gene annotation enrichment analysis was performed to elucidate the biological processes and pathways associated with each gene cluster. The top annotation clusters are shown in bar plots; the value of the abscissa reflects the annotation enrichment score. Group names on the ordinate were based on interpretation of the underlying annotations.

Similar articles

Cited by

References

    1. Gottesfeld JM, Forbes DJ. Trends Biochem Sci. 1997;22:197–202. - PubMed
    1. Martinez-Balbas MA, Dey A, Rabindran SK, Ozato K, Wu C. Cell. 1995;83:29–38. - PubMed
    1. Muchardt C, Reyes J-C, Bourachot B, Legouy E, Yaniv M. EMBO J. 1996;15:3394–3402. - PMC - PubMed
    1. Prasanth KV, Sacco-Bubulya PA, Prasanth SG, Spector DL. Mol Biol Cell. 2003;14:1043–1057. - PMC - PubMed
    1. Choi J-Y, Pratap J, Javed A, Zaidi SK, Xing L, Balint E, Dalamangas S, Boyce B, van Wijnen AJ, Lian JB, et al. Proc Natl Acad Sci USA. 2001;98:8650–8655. - PMC - PubMed

Publication types

MeSH terms

Substances

LinkOut - more resources