Comparative Study
. 2007 Feb 27;104(9):3432-7.
doi: 10.1073/pnas.0611192104. Epub 2007 Feb 20.

MicroRNA-192 in diabetic kidney glomeruli and its function in TGF-beta-induced collagen expression via inhibition of E-box repressors

Affiliations
Comparative Study

MicroRNA-192 in diabetic kidney glomeruli and its function in TGF-beta-induced collagen expression via inhibition of E-box repressors

Mitsuo Kato et al. Proc Natl Acad Sci U S A. .

Abstract

Key features of diabetic nephropathy (DN) include the accumulation of extracellular matrix proteins such as collagen 1-alpha 1 and -2 (Col1a1 and -2). Transforming growth factor beta1 (TGF-beta), a key regulator of these extracellular matrix genes, is increased in mesangial cells (MC) in DN. By microarray profiling, we noted that TGF-beta increased Col1a2 mRNA in mouse MC (MMC) but also decreased mRNA levels of an E-box repressor, deltaEF1. TGF-beta treatment or short hairpin RNAs targeting deltaEF1 increased enhancer activity of upstream E-box elements in the Col1a2 gene. TGF-beta also decreased the expression of Smad-interacting protein 1 (SIP1), another E-box repressor similar to deltaEF1. Interestingly, we noted that SIP1 is a target of microRNA-192 (miR-192), a key miR highly expressed in the kidney. miR-192 levels also were increased by TGF-beta in MMC. TGF-beta treatment or transfection with miR-192 decreased endogenous SIP1 expression as well as reporter activity of a SIP1 3' UTR-containing luciferase construct in MMC. Conversely, a miR-192 inhibitor enhanced the luciferase activity, confirming SIP1 to be a miR-192 target. Furthermore, miR-192 synergized with deltaEF1 short hairpin RNAs to increase Col1a2 E-box-luc activity. Importantly, the in vivo relevance was noted by the observation that miR-192 levels were enhanced significantly in glomeruli isolated from streptozotocin-injected diabetic mice as well as diabetic db/db mice relative to corresponding nondiabetic controls, in parallel with increased TGF-beta and Col1a2 levels. These results uncover a role for miRs in the kidney and DN in controlling TGF-beta-induced Col1a2 expression by down-regulating E-box repressors.


Conflict of interest statement

The authors declare no conflict of interest.

Figures
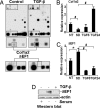
Fig. 1.
Fig. 1.
Profiling genes regulated by TGF-β in MMC. (A) Representative Oligo GEArray profiling results. Intensities of several spots were up-regulated or down-regulated by treating serum-depleted MMC with TGF-β (10 ng/ml for 24 h) (Top). Close-up magnified view of regions containing Col1a2 and δEF1 genes are shown in Middle and Bottom and demonstrate that TGF-β-treated MMC have marked increase in the intensities of Col1a2 spots but decrease in δEF1 spots (each region has four replicate spots). (B and C) Verification of Col1a2 and δEF1 expression levels by real-time qPCR. Col1a2 gene was decreased by serum depletion (SD) relative to cells growing in serum (NT, no treatment), whereas TGF-β treatment significantly increased its expression by 24 h but not at 6 h (B). Conversely, δEF1 expression was significantly increased by serum depletion, and this was reversed by TGF-β, which down-regulated δEF-1 by 6 and 24 h. ∗, P < 0.05; #, P < 0.01. TGF6, TGF-β for 6 h; TGF24, TGF-β for 24 h. (D) Western blot analysis of δEF1 protein levels. Similar to the mRNA data, serum depletion increased δEF1 protein expression, whereas TGF-β (24 h) reversed (decreased) the expression.
Fig. 2.
Fig. 2.
δEF1 negatively regulates the enhancer region of Co1a2 gene. (A) Schematic diagram of the far upstream region of Col1a2 gene. Three E-boxes are noted in the enhancer region located 16-kb upstream of the Col1a2 gene transcription start site. This region was amplified by PCR using primers indicated by arrows. Details of the enhancer sequence are shown in SI Fig. 6. (B) ChIP assay to evaluate δEF1 occupancy at the enhancer region containing E-boxes in the Col1a2 gene. After IP with δEF1 antibody, target ChIPed DNA amplification (with primers shown in A) was noted only in serum-depleted MMC (Upper). Preimmune IgG served as negative control. DNA without IP was used as input control. Serum depletion increased δEF1 expression and its Col1a2 gene enhancer occupancy. Bar graph (Lower) shows δEF1 binding quantified by real-time qPCR. Relative amount was calculated by the ratio of ChIPed DNA/input control DNA. A 6-fold increase in δEF1 occupancy was observed in serum-depleted cells (SD) compared with serum-treated controls (NT). TGF-β treatment gradually decreased the amount of δEF1 at the promoter from 6 to 24 h (TGF6 and TGF24). ∗, P < 0.05; #, P < 0.01. (C) The same enhancer DNA fragment with E-boxes was cloned into the pGL3-promoter driven by SV40 promoter. TGF-β treatment increased luciferase activity (∗, P < 0.05). (D) δEF1 shRNA increased transcription from the Col1a2 promoter E-box elements. δEF1 shRNA cotransfected with the reporter construct pGL3-promoter-Col1a2-Ebox caused a significant increase in luciferase activity (∗, P < 0.05). (E) Down-regulation of SIP1 in response to TGF-β. SIP1 mRNA expression levels were quantified by real-time qPCR. Similar to δEF1, SIP1 expression was increased by serum depletion (SD), but TGF-β treatment reversed this by decreasing expression from 6 h posttreatment up to 24 h (#, P < 0.01). (F) Scheme showing that TGF-β inhibition of δEF1, a repressor of the E-box in the Col1a2 promoter, can increase collagen gene expression. Other negative factors or E-box repressors (SIP1) also may cooperate to regulate the enhancer elements in the Col1a2 gene.
Fig. 3.
Fig. 3.
Expression of miRs in mouse tissues and MMC and regulation by TGF-β. (A) Verification of miR-194 expression in mouse tissues by using real-time qPCR. miR-194 expression was high in mouse liver and kidney tissue but undetected in the spleen. (B) miR-192 was highly expressed in mouse kidney, spleen, and MMC, with lower levels in liver. (C) miR-215 was expressed exclusively in the kidney with very little in other tissues or MMC. (D) miR-194 expression was very low in MMC, but serum depletion and TGF-β treatment both increased its expression. (E) Serum depletion decreased miR-192 in MMC, whereas TGF-β increased miR-192 expression from 6 to 24 h (∗, P < 0.05). (F) Serum depletion increased miR-215 expression, which was reversed by TGF-β.
Fig. 4.
Fig. 4.
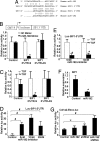
Regulation of SIP1 gene by miR-192 via the 3′ UTR. (A) Alignment of hsa-miR-192 and mmu-miR-192 with human SIP1 3′ UTR and mouse SIP1 3′ UTR based on software from the Memorial Sloan–Kettering Cancer Center (http://cbio.mskcc.org). Seven nucleotides in the 5′ region of miR-192 (human and mouse) contain a perfect match with the 3′ UTR sequence of the human and mouse SIP1 genes. Numbers next to the SIP1 3′ UTR sequence are relative to the start sites of the 3′ UTR. Sequences of these regions were 100% conserved in human, mouse, and rat (SI Fig. 8). (B) miR-192-mediated inhibition of luciferase reporter activity in vector containing the SIP1 3′ UTR sequence. The SIP1 3′ UTR luciferase reporter (0.5 μg) was cotransfected with either the miR-192 Mimic (+miR-192 Mimic) or the negative control mimic (NC Mimic) in MMC. A significant decrease in luciferase activity with miR-192 mimic was observed with the SIP1 3′ UTR-S (sense) construct (∗, P < 0.05) but no change with the control constructs (without SIP1 3′ UTR, control) or with SIP1 3′ UTR AS construct (AS). (C) TGF-β treatment decreased the reporter activity of Luc-SIP1 3′ UTR construct (∗, P < 0.05). No change in luciferase activity was seen with control plasmid without 3′ UTR or plasmid with AS SIP1 3′ UTR. (D) miR-192 inhibitor increased luciferase activity of Luc-SIP1 3′ UTR construct (#, P < 0.01). (E) TGF-β treatment reversed the induction of luciferase activity by the miR-192 inhibitor (∗, P < 0.05). MMC were transfected with either Luc-SIP1 3′ UTR or miR-192 inhibitor (5 nM and 10 nM) and treated with TGF-β. (F) miR-192 decreased SIP1 expression. TCMK-1 cells were transfected with miR-192 Mimic and SIP1 mRNA expression quantified by real-time qPCR (∗, P < 0.05). (G) Cooperation between miR-192 and δEF1 shRNA at the E-box region. miR-192 alone slightly increased Col1a2-Ebox-luc activity. δEF1 shRNA caused a significant increase of reporter activity (∗, P < 0.05). Cotransfection of miR-192 and δEF1 shRNA lead to significant enhancement of reporter activity over their individual contributions (#, P < 0.01).
Fig. 5.
Fig. 5.
Expression of TGF-β, Col1a2, and miR-192 levels in glomeruli from mouse models of type 1 and type 2 diabetes. Total RNAs from normal and diabetic mouse kidney glomeruli were extracted, and the expression levels of TGF-β1, Col1a2, and miR-192 examined by real-time qPCR. (A–C) RNA from type 1 diabetic model (streptozotocin-treated) and control mice. (D–F) RNA from type 2 diabetic model (db/db) and control (db/+) mice. Significant increase (#, P < 0.01) of the expression levels of TGF-β1, Col1a2, and miR-192 was observed in diabetic glomeruli relative to healthy control. (G) A previously uncharacterized mechanism for TGF-β-induced Col1a2 gene expression. Diabetic condition increases TGF-β levels in kidney glomeruli and MC. TGF-β relieves repression at the E-box region of Col1a2 gene by reducing the expression of two E-box repressors, δEF1 (by unknown mechanisms) and SIP1 (by increasing miR-192 expression, possibly via Ets-1), to increase Col1a2 gene expression.

Similar articles

Cited by

References

    1. Ziyadeh FN. Am J Kidney Dis. 1993;22:736–744. - PubMed
    1. Reeves WB, Andreoli TE. Proc Natl Acad Sci USA. 2000;97:7667–7669. - PMC - PubMed
    1. Sharma K, Ziyadeh FN. Diabetes. 1995;44:1139–1146. - PubMed
    1. Kato M, Yuan H, Xu Z-G, Lanting L, Li S-L, Wang M, Hu MC-T, Reddy M, Natarajan R. J Am Soc Nephrol. 2006;17:3325–3335. - PubMed
    1. Roberts AB, McCune BK, Sporn MB. Kidney Int. 1992;41:557–559. - PubMed

Publication types

MeSH terms