Comparative Study
. 2007 Feb 27;104(9):3562-7.
doi: 10.1073/pnas.0611396104. Epub 2007 Feb 20.

Cellular scaling rules for primate brains

Affiliations
Comparative Study

Cellular scaling rules for primate brains

Suzana Herculano-Houzel et al. Proc Natl Acad Sci U S A. .

Abstract

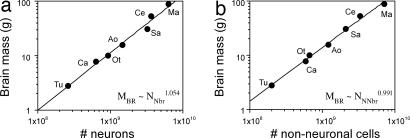
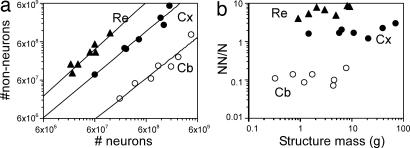
Primates are usually found to have richer behavioral repertoires and better cognitive abilities than rodents of similar brain size. This finding raises the possibility that primate brains differ from rodent brains in their cellular composition. Here we examine the cellular scaling rules for primate brains and show that brain size increases approximately isometrically as a function of cell numbers, such that an 11x larger brain is built with 10x more neurons and approximately 12x more nonneuronal cells of relatively constant average size. This isometric function is in contrast to rodent brains, which increase faster in size than in numbers of neurons. As a consequence of the linear cellular scaling rules, primate brains have a larger number of neurons than rodent brains of similar size, presumably endowing them with greater computational power and cognitive abilities.


Conflict of interest statement

The authors declare no conflict of interest.

Figures

Fig. 1.
Fig. 1.
MBR of different primate species and the tree shrew increases as a linear function of total number of neuronal (a) and nonneuronal cells (b). Each point represents the average for the species. (a) Variations in MBR as a function of the number of neurons in the brain (NNbr) are equally well described by the linear equation MBR = −3.127 + 1.372 × 10⁻⁸ × NNbr (r2 = 0.970, P < 0.0001) and by the power function MBR = 3.7 × 10⁻⁹ × NNbr1.054 (shown in graph; P < 0.0001). (b) Variations in MBR as a function of the number of nonneuronal cells in the brain (NNNbr) are equally well described by the linear equation MBR = 2.519 + 1.241 × 10⁻⁸ × NNNbr (r2 = 0.981, P < 0.0001) and by the power function MBR = 1.688 × 10⁻⁸ × NNbr0.991 (shown in graph; P < 0.0001). Tu, Tupaia glis; Ca, Callithrix jacchus; Ot, Otolemur garnettii; Ao, Aotus trivirgatus; Sa, Saimiri sciureus; Ce, Cebus apella; Ma, Macaca fascicularis.
Fig. 2.
Fig. 2.
Percentages of mass (a), number of neurons (b), and number of nonneuronal cells (c) contained in the cerebral cortex (filled circles), cerebellum (open circles), and remaining structures (filled triangles) relative to the whole brain in each species, plotted against MBR. Values for Tupaia (Tu) are indicated. The power functions relating MBR and the percentages of mass, neurons, and nonneuronal cells in the remaining areas in primates are shown in the respective graphs; all other comparisons were not significant (P > 0.05).
Fig. 3.
Fig. 3.
Cellular scaling rules for primate brains. (a) Structure mass as a function of the NN in the structure. (b) Structure mass as a function of the NNN in the structure. Each point represents the average values for one species. Plots are fitted with power functions with exponents described in the text (all P values <0.01). Filled circles, cerebral cortex (Cx); open circles, cerebellum (Cb); filled triangles, remaining structures (Re).
Fig. 4.
Fig. 4.
Variation in neuronal (a) and nonneuronal (b) cell density in cerebral cortex, cerebellum, and remaining areas plotted against MBR. No correlation reaches significance (all P values >0.05). Filled circles, cerebral cortex (Cx); open circles, cerebellum (Cb); filled triangles, remaining structures (Re).
Fig. 5.
Fig. 5.
The NNN varies linearly with the NN in each structure. (a) NNN in the cerebral cortex, cerebellum, and remaining areas plotted as a function of the total number of neurons in these structures. Power functions of exponents 1.119, 1.064, and 1.217 are plotted, but graphs are equally well fitted with linear functions. (b) Ratio of nonneuronal/neuronal cells in each structure plotted against structure mass. No significant correlation is found across primate species. Filled circles, cerebral cortex (Cx; P = 0.2774); open circles, cerebellum (Cb; P = 0.5653); filled triangles, remaining structures (Re; P = 0.2248).

References

    1. Stolzenburg JU, Reichenbach A, Neumann M. Glia. 1989;2:78–84. - PubMed
    1. Tower DB. J Comp Neurol. 1954;101:19–51. - PubMed
    1. Haug H. Am J Anat. 1987;180:126–142. - PubMed
    1. Frahm HD, Stephan H, Stephan M. J Hirnforsch. 1982;23:375–389. - PubMed
    1. Williams RW, Herrup K. Annu Rev Neurosci. 1988;11:423–453. - PubMed

Publication types

LinkOut - more resources