Comparative Study
. 2007 Mar 14;27(11):2744-50.
doi: 10.1523/JNEUROSCI.5352-06.2007.

Dynamics of protein kinase A signaling at the membrane, in the cytosol, and in the nucleus of neurons in mouse brain slices

Affiliations
Comparative Study

Dynamics of protein kinase A signaling at the membrane, in the cytosol, and in the nucleus of neurons in mouse brain slices

Nicolas Gervasi et al. J Neurosci. .

Abstract

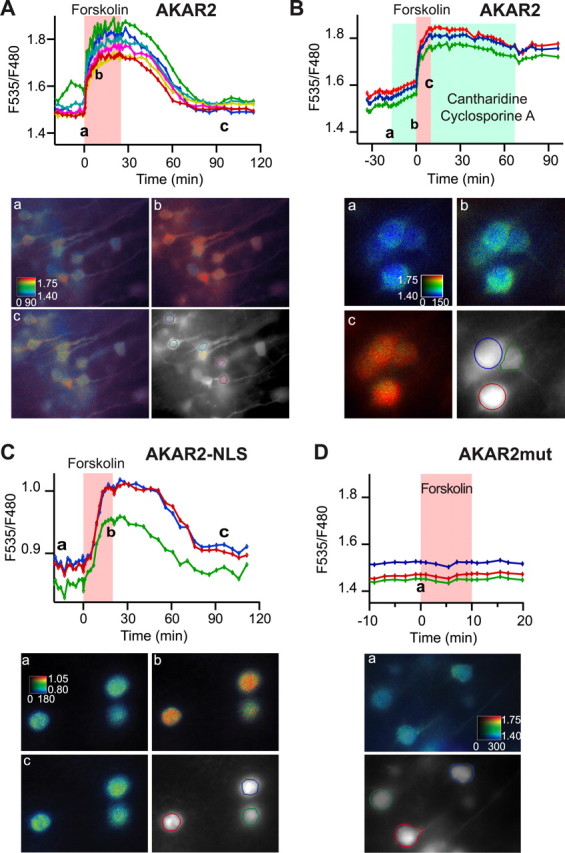
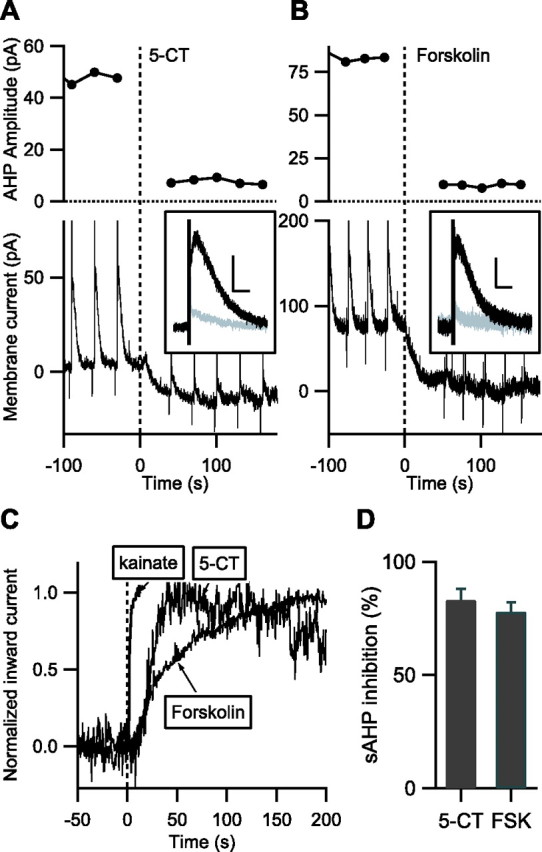
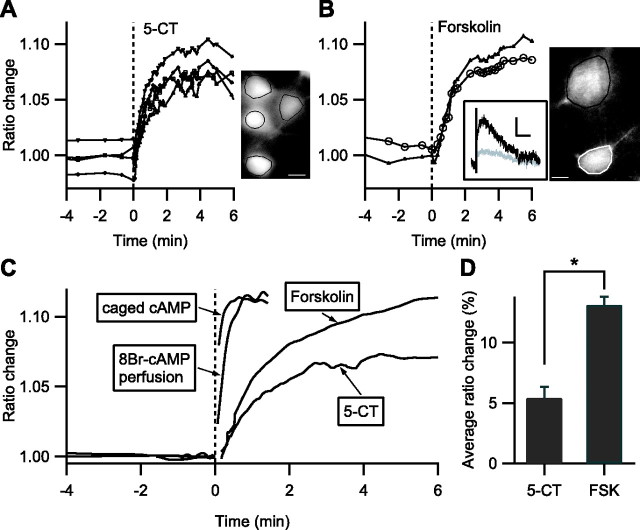
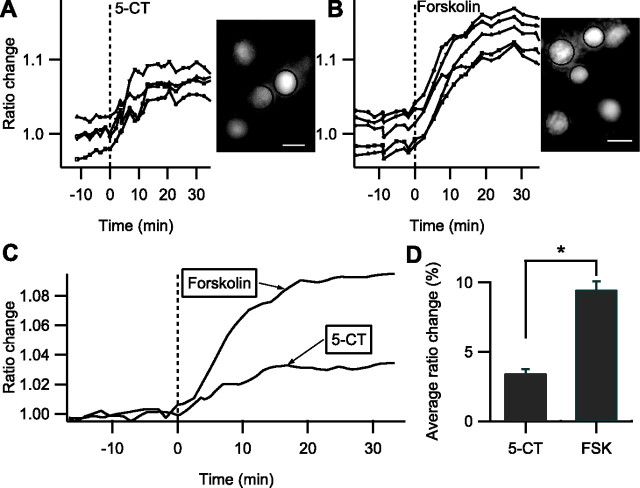
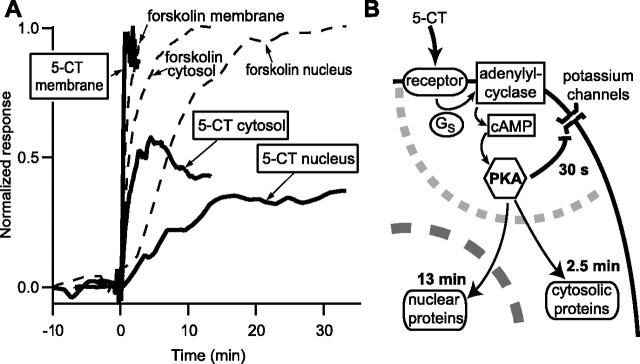
The cAMP-dependent protein kinase A (PKA) plays a ubiquitous role in the regulation of neuronal activity, but the dynamics of its activation have been difficult to investigate. We used the genetically encoded fluorescent probe AKAR2 to record PKA activation in the cytosol and the nucleus of neurons in mouse brain slice preparations, whereas the potassium current underlying the slow afterhyperpolarization potential (sAHP) in thalamic intralaminar neurons was used to monitor PKA activation at the membrane. Adenylyl cyclase was stimulated either directly using forskolin or via activation of 5-HT7 receptors. Both stimulations produced a maximal effect on sAHP, whereas in the cytosol, the amplitude of the 5-HT7 receptor-mediated response was half of that after direct adenylyl cyclase stimulation with forskolin. 5-HT7-mediated PKA responses were obtained in 30 s at the membrane, in 2.5 min in the cytosol, and in 13 min in the nucleus. Our results show in morphologically intact mammalian neurons the potential physiological relevance of PKA signal integration at the subcellular level: neuromodulators produce fast and powerful effects on membrane excitability, consistent with a highly efficient functional coupling between adenylyl cyclases, PKA, and target channels. Phosphorylation in the cytosol is slower and of graded amplitude, showing a differential integration of the PKA signal between the membrane and the cytosol. The nucleus integrates these cytosolic signals over periods of tens of minutes, consistent with passive diffusion of the free catalytic subunit of PKA into the nucleus, eventually resulting in a graded modulation of gene expression.


Figures

Figure 1.
Figure 1.
A–D, Somatosensory cortical brain slices expressing AKAR2 (A, C), AKAR2-NLS (B), and AKAR2mut (D) and their responses to forskolin application. Each trace indicates the F535/F480 emission ratio measured on one individual neuron. The ratio was averaged over the regions indicated by the colored contour drawn in the grayscale image. Pseudocolor images show for each pixel the F535/F480 ratio coded in hue and the F535 intensity coded in intensity. Images correspond to the data point indicated by the letters on the graph. Grayscale images show the F535 fluorescence. Forskolin (13 μm) was applied in the bath for the duration indicated by the red shade on the graph. Cantharidin (50 μm) and cyclosporin A (5 μm) were added to the bath solution for the duration indicated by the green shade in C. The calibration square represents horizontally the intensity in counts per pixel per second and represents vertically the F535/F480 emission ratio. The calibration square is 20 μm (A, D) or 10 μm (B, C) wide.
Figure 2.
Figure 2.
A, B, In intralaminar thalamic nuclei, the I sAHP and the tonic outward current are suppressed after fast focal application of 100 nm 5-CT (A) or 13 μm forskolin (B). Time 0 indicates the beginning of drug ejection. A, The top graph shows the amplitude of I sAHP. The bottom trace shows the whole-cell current with three sAHP protocols before and five sAHP protocols after bath application of 5-CT. The inset shows the averaged and baseline-subtracted currents from the trace presented above, before (black; 5 trials) and after (gray; 5 trials) 5-CT application. Calibration: 20 pA, 3 s. B, Same as A with 13 μm forskolin as the agonist. Calibration: 30 pA, 3 s. C, Average whole-cell current during fast application of 10 μm kainate, 100 nm 5-CT, and 13 μm forskolin. Traces are presented inverted for legibility. The response to kainate is an indicator of the time course of drug diffusion in the brain slice. D, Average effect of 5-CT and forskolin (FSK) on I sAHP amplitude.
Figure 3.
Figure 3.
Fast focal application of 5-CT and forskolin on intralaminar thalamic neurons expressing AKAR2. Each trace in A and B indicates the ratio change measured on one individual neuron shown in the grayscale image (F535 fluorescence). Scale bars: 10 μm. Time 0 is the beginning of the agonist application: A, 100 nm 5-CT; B, 13 μm forskolin. The cell indicated by the white outline and plotted as open circles was simultaneously recorded by patch clamp, and the inset shows its I sAHP before (black) and during (gray) forskolin application. Calibration: 20 pA, 3 s. C, Average ratio change during fast application of 5-CT and forskolin. The normalized and averaged responses to cAMP uncaging or intracellular perfusion with 8Br-cAMP are overlaid for comparison. D, Average ratio change in response to 5-CT or forskolin (FSK). Asterisk indicates that the difference is statistically significant.
Figure 4.
Figure 4.
Fast focal application of 5-CT and forskolin on intralaminar thalamic neurons expressing AKAR2-NLS. Each trace in A and B indicates the ratio change measured on one individual neuron shown in the grayscale image (F535 fluorescence). Scale bars: 10 μm. Time 0 is the beginning of the agonist application: A, 100 nm 5-CT; B, 13 μm forskolin. C, Average ratio change during fast application of 5-CT and forskolin. D, Average ratio change in response to 5-CT or forskolin (FSK). Asterisk indicates that the difference is statistically significant.
Figure 5.
Figure 5.
Summary. A, Kinetics of PKA responses at the membrane, in the cytosol, and in the nucleus in intralaminar thalamic neurons are overlaid for comparison. The thick trace represents the responses to 100 nm 5-CT. Dotted lines are responses to 13 μm forskolin, used to normalize the amplitude for the cytosol and nucleus. B, Schematic of the successive events. The gray dotted line delimits the region where the PKA signaling cascade is functionally coupled with the potassium channels.

References

    1. Bacskai BJ, Hochner B, Mahaut-Smith M, Adams SR, Kaang BK, Kandel ER, Tsien RY. Spatially resolved dynamics of cAMP and protein kinase A subunits in Aplysia sensory neurons. Science. 1993;260:222–226. - PubMed
    1. Barnes AP, Livera G, Huang P, Sun C, O'Neal WK, Conti M, Stutts MJ, Milgram SL. Phosphodiesterase 4D forms a cAMP diffusion barrier at the apical membrane of the airway epithelium. J Biol Chem. 2005;280:7997–8003. - PubMed
    1. Bredenbeek PJ, Frolov I, Rice CM, Schlesinger S. Sindbis virus expression vectors: packaging of RNA replicons by using defective helper RNAs. J Virol. 1993;67:6439–6446. - PMC - PubMed
    1. Carnegie GK, Scott JD. A-kinase anchoring proteins and neuronal signaling mechanisms. Genes Dev. 2003;17:1557–1568. - PubMed
    1. Cesetti T, Hernandez-Guijo JM, Baldelli P, Carabelli V, Carbone E. Opposite action of β1- and β2-adrenergic receptors on Ca(V)1 L-channel current in rat adrenal chromaffin cells. J Neurosci. 2003;23:73–83. - PMC - PubMed

Publication types

Substances

LinkOut - more resources