Comparative Study
. 2007 Mar 14;27(11):2760-80.
doi: 10.1523/JNEUROSCI.3147-06.2007.

Relationship between unconstrained arm movements and single-neuron firing in the macaque motor cortex

Affiliations
Comparative Study

Relationship between unconstrained arm movements and single-neuron firing in the macaque motor cortex

Tyson N Aflalo et al. J Neurosci. .

Abstract

The activity of single neurons in the monkey motor cortex was studied during semi-naturalistic, unstructured arm movements made spontaneously by the monkey and measured with a high resolution three-dimensional tracking system. We asked how much of the total neuronal variance could be explained by various models of neuronal tuning to movement. On average, tuning to the speed of the hand accounted for 1% of the total variance in neuronal activity, tuning to the direction of the hand in space accounted for 8%, a more complex model of direction tuning, in which the preferred direction of the neuron rotated with the starting position of the arm, accounted for 13%, tuning to the final position of the hand in Cartesian space accounted for 22%, and tuning to the final multijoint posture of the arm accounted for 36%. One interpretation is that motor cortex neurons are significantly tuned to many control parameters important in the animal's repertoire, but that different control parameters are represented in different proportion, perhaps reflecting their prominence in everyday action. The final posture of a movement is an especially prominent control parameter although not the only one. A common mode of action of the monkey arm is to maintain a relatively stable overall posture while making local adjustments in direction during performance of a task. One speculation is that neurons in motor cortex reflect this pattern in which direction tuning predominates in local regions of space and postural tuning predominates over the larger workspace.


Figures

Figure 1.
Figure 1.
Images of the brain of monkey 1 showing the studied area of cortex. A, MRI reconstruction of the cortical surface showing sulcal pattern. Studied region is in lightened shading. The white line indicates the section shown in B. B, Parasagittal section (0.5 mm thick) through the studied area of cortex. Studied region is in lightened shading.
Figure 2.
Figure 2.
Range of movements in the naturalistic movement set. A, Front view of 514 hand movements made during 10 min of testing one neuron. Each trail of dots is equivalent to one movement measured at 14.3 ms intervals. Frame is 45 cm tall. B, Correlations among the final positions of the eight degrees of freedom among the recorded movements. Degrees of freedom are as follows: 1, shoulder azimuth; 2, shoulder elevation; 3, shoulder internal/external rotation; 4, elbow extension; 5, forearm pronation; 6, wrist extension; 7, wrist adduction; 8, grip aperture. Units on x- and y-axes of each plot are degrees of joint angle, except for degree of freedom 8, which is expressed in centimeters.
Figure 3.
Figure 3.
Speed tuning of motor cortex neurons. A, Firing rate and hand speed averaged over 321 movements for one example neuron. When neuronal data were shifted forward by 71 ms (the optimal time lag for this neuron), the two curves matched closely with an R 2 of 0.87. B, Frequency histogram of R 2 values for all 64 neurons tested as in A. C, Firing rate versus hand speed for 9018 time bins during hand movement studied for one example neuron. The two variables showed a small but highly significant correlation (R 2 = 0.03; p = 1.5 × 10⁻¹⁷). D, Frequency histogram of R 2 values for all 64 neurons tested as in C.
Figure 4.
Figure 4.
Direction tuning of motor cortex neurons. A, Front view of 26 selected hand movements made during 10 min of testing one neuron. Each trail of dots is equivalent to one movement measured at 14.3 ms intervals. Frame is 45 cm tall. Each movement shown originated within a 5 cm radius sphere of central space and was between 6 and 15 cm in length. B, Tuning of an example neuron to direction, based on selected movement set. x-Axis shows angular difference between the direction of each movement and the preferred direction; y-axis shows mean firing rate during each movement; for cosine tuning to direction, R 2 = 0.43, p = 0.0001. C, Frequency histogram of R 2 values for all neurons tested as in B. D, Front view of full set of 320 hand movements made during testing of one neuron. E, Direction tuning of an example neuron (same neuron as in B), based on full movement set. R 2 = 0.05, p = 0.00008. Note that a new preferred direction was obtained by regression, and therefore the data points shown in B do not plot to the same location on the x-axis as in E. F, Frequency histogram of R 2 values for all neurons tested as in E.
Figure 5.
Figure 5.
Rotation of preferred direction with starting hand position. A, A preferred direction model was tested in which the preferred direction of a cell was not fixed but instead could rotate as the start position of the hand rotated. Frequency histogram shows AZ and EL values for all cells tested. The AZ rotation index indicates the ratio between the starting azimuth angle of the arm and the azimuth angle of the preferred direction of the neuron. The peak in AZ near 1 indicates that the preferred direction of most neurons tended to rotate in the same direction and by a similar amount as the starting angle of the arm. Similarly, the EL rotation index indicates the ratio between the starting elevation angle of the arm and the elevation angle of the preferred direction of the neuron. B, Frequency histogram of R 2 values for all cells tested with this model of a rotating preferred direction.
Figure 6.
Figure 6.
Change in preferred direction with starting arm posture. A, Results for one neuron. All movements were divided on a median split according to a raised elbow parameter (see Results, Direction tuning IV: changes of preferred direction with changes in initial posture). The preferred direction was calculated separately for the two sets of movements, and the difference in preferred direction (Δθ) is shown as the vertical black line. To assess the reliability of this result, the movements were also randomly divided into two groups and a Δθ was calculated. This random division was performed 200 times, and the results are shown as a frequency histogram. On this randomized distribution, the Δθ of the nonrandom, posture-based split was significantly above the mean (Z = 2.81; p = 0.0051). B, Z scores for all cells tested as in A, This distribution of Z scores was significantly >0 (mean of 0.51; t = 2.89; p = 0.0057).
Figure 7.
Figure 7.
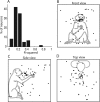
Tuning of neurons to hand end point. A, Each neuron was tested with a tuning model in which the neuron fired most during movements that terminated with the hand at or near a specific location in space and fired progressively less during movements for which the hand terminated progressively farther from the preferred location. The graph shows a frequency histogram of R 2 values for all cells tested with this end-point model. B–D, Preferred hand positions as determined by the end-point tuning model, displayed from three perspectives. The schematic monkey drawing indicates approximate scale and orientation.
Figure 8.
Figure 8.
End-point tuning of three example neurons. A1–A3, Mean firing rate of example neurons 1–3 during each movement as a function of the distance (centimeters) between the end of the movement and the preferred end point determined by regression analysis. The neurons fired more during movements that terminated closer to the preferred end point. B1–B3, Same data as in A but with the x-axis replotted in units of the SDs of the Gaussian tuning curve, displaying the tuning to end point more clearly. C1–C3, Rasters showing high neuronal activity of example neurons 1–3 during the 10% of movements that terminated nearest to the preferred end point and low neuronal activity during the 10% of movements that terminated farthest from the preferred end point. Red tic marks indicate start and end of movement.
Figure 9.
Figure 9.
Direction tuning does not explain end point tuning. A1, A2, Data from two example neurons. The dots show the final hand position for the 10% of movements that terminated closest to the calculated preferred position. The line shows the preferred direction of movement as calculated using the same local set of movements. The blue dot shows the end of the movement vector. B1, B2, Data from the same neurons shown in A. Each line depicts a movement (straight line connecting the start and end point of the movement), and each red dot shows the end point of the movement, for the same movements whose end positions are shown in A.
Figure 10.
Figure 10.
Comparison of four regression models. Each neuron was tested with a tuning model in which the neuron fired most during movements that terminated with the eight joints of the arm at or near a specific postural configuration. This end-posture tuning is shown as a frequency histogram of R 2 values. Also shown is a frequency histogram of speed tuning (from Fig. 3 D), direction tuning in which the preferred direction was allowed to rotate depending on starting hand position (from Fig. 5 B), and tuning to the three-dimensional end point of the movement (from Fig. 7 A).
Figure 11.
Figure 11.
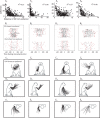
End-posture tuning of four example neurons. A1–A4, Data from example neurons 1–4. For each neuron, the preferred multijoint posture was determined by regression analysis. The final posture of each movement was compared with the preferred posture. The distance between them was calculated in eight-dimensional posture space. Distance was measured in units of SDs of the Gaussian tuning function, to express all eight dimensions in posture space in equivalent units. This distance is plotted on the x-axis, and firing rate during the movement is plotted on the y-axis. B1–B4, Rasters showing high neuronal activity during the 10% of movements that terminated nearest to the preferred end posture and low neuronal activity during the 10% of movements that terminated farthest from the preferred end posture. Red tic marks indicate start and end of movement. C1–C4, Stick-figure drawings showing front view of the end postures for the 10% of movements that terminated nearest to the preferred end posture. Three joints are shown: shoulder, elbow, and wrist. The schematic monkey drawing indicates approximate scale and orientation. D1–D4, Same as C but side view. E1–E4, Same as C but top view.
Figure 12.
Figure 12.
Distribution of joint angles preferred by neurons. For each joint, a frequency histogram shows the proportion of neurons tuned to a particular final joint angle. Only the 50% most sharply tuned neurons were plotted for each graph. Most neurons were tuned to more than one joint and are therefore represented on more than one histogram.
Figure 13.
Figure 13.
Tuning of neurons to subsets of joints. A, Data from one example neuron. The end-posture regression analysis returned a set of preferred joint angles to which the cell was tuned in a Gaussian manner. For each joint, a tuning width index was calculated. Tuning width index is the width of Gaussian tuning curve at half height in degrees of joint angle/natural range of joint motion measured during movement. Tuning index of 1 indicates that the width of the tuning curve at half height approximated the normal range of joint motion. Lower tuning index corresponds to sharper tuning. The graph shows that the neuron was sharply tuned to four joints and poorly tuned to the remaining four joints. The joints are (in order) shoulder azimuth, shoulder elevation, shoulder external/internal rotation, elbow extension, forearm pronation, wrist extension, wrist adduction, and grip aperture. B, An example neuron sharply tuned to five of the eight joints. C, An example neuron sharply tuned to six of the eight joints. D, An example neuron sharply tuned to seven of the eight joints. E, For each neuron, the joints were arranged from most sharply tuned to least sharply tuned; the results were then averaged across neurons. On average, neurons were well tuned to four of the eight joints.
Figure 14.
Figure 14.
Temporal offsets for six regression models. For each regression model, the kinematic data were selected from a fixed time period during the movement, and the neuronal data were selected from a time period equal in duration but offset by a temporal lag. For each neuron, the temporal offset that optimized the regression was selected. These optimal temporal offsets are shown in the frequency histogram in which the x-axis represents temporal offset. Negative values indicate neuronal activity leading movement. A, Temporal offsets for direction tuning following the method in Results (Direction tuning II: global). B, Temporal offsets for direction tuning following the method in Results (Direction tuning III: rotation of preferred direction with changes in starting hand position). C, Temporal offsets for speed tuning following the method in Results (Speed tuning I). D, Temporal offsets for end-posture tuning. E, Temporal offsets for start-posture tuning. F, Temporal offsets for start-posture tuning in which the range of possible offsets was extended downward to −1000.
Figure 15.
Figure 15.
Frequency histogram of R 2 values for hierarchical regression. This regression model included tuning to a preferred final posture, tuning to a preferred final hand position, tuning to a preferred direction that can rotate with changes in the starting hand position, and a linear dependence on mean speed.
Figure 16.
Figure 16.
Analysis of simulated noisy neurons. A, Simulated direction-tuned neuron tested on direction, end-point, and end-posture regression models. B, Simulated end-point tuned neuron tested on the same three models. C, Simulated end-posture tuned neuron tested on the same three models. D, Simulated neuron with no tuning on the same three models.
Figure 17.
Figure 17.
EMG results for biceps during naturalistic movements. A, Right, EMG traces during movements involving elbow flexion. Left, EMG traces during movements involving elbow extension. B, An eight-dimensional regression against joint velocity was performed and returned an R 2 = 0.41. The unique contribution for each joint, when the contributions of the other seven joints were regressed out, was calculated. The figure shows the percentage of contribution to the R 2 for each joint. As expected, the elbow joint showed the largest effect. Joints on x-axis are (in order) shoulder azimuth, shoulder elevation, shoulder external/internal rotation, elbow extension, forearm pronation, wrist extension, wrist adduction, and grip aperture. DOF, Degrees of freedom.

Similar articles

Cited by

References

    1. Aflalo T, Graziano MSA. Partial tuning of motor cortex neurons to final posture in a free-moving paradigm. Proc Natl Acad Sci USA. 2006;103:2909–2914. - PMC - PubMed
    1. Ashe J, Georgopoulos AP. Movement parameters and neural activity in motor cortex and area 5. Cereb Cortex. 1994;4:590–600. - PubMed
    1. Bagesteiro LB, Sainburg RL. Handedness: dominant arm advantages in control of limb dynamics. J Neurophysiol. 2002;88:2408–2421. - PMC - PubMed
    1. Bates DM, Watts DG. Nonlinear regression analysis and its applications. New York: Wiley; 1988.
    1. Caminiti R, Johnson PB, Urbano A. Making arm movements within different parts of space: dynamic aspects in the primate motor cortex. J Neurosci. 1990;10:2039–2058. - PMC - PubMed

Publication types

LinkOut - more resources