Comparative Study
. 2007 Mar 14;27(11):2802-14.
doi: 10.1523/JNEUROSCI.4376-06.2007.

HCN pacemaker channel activation is controlled by acidic lipids downstream of diacylglycerol kinase and phospholipase A2

Affiliations
Comparative Study

HCN pacemaker channel activation is controlled by acidic lipids downstream of diacylglycerol kinase and phospholipase A2

Keri J Fogle et al. J Neurosci. .

Abstract

Hyperpolarization-activated pacemaker currents (I(H)) contribute to the subthreshold properties of excitable cells and thereby influence behaviors such as synaptic integration and the appearance and frequency of intrinsic rhythmic activity. Accordingly, modulation of I(H) contributes to cellular plasticity. Although I(H) activation is regulated by a plethora of neurotransmitters, including some that act via phospholipase C (PLC), the only second messengers known to alter I(H) voltage dependence are cAMP, internal protons (H+(I)s), and phosphatidylinositol-4,5-phosphate. Here, we show that 4beta-phorbol-12-myristate-13-acetate (4betaPMA), a stereoselective C-1 diacylglycerol-binding site agonist, enhances voltage-dependent opening of wild-type and cAMP/H+(I)-uncoupled hyperpolarization-activated, cyclic nucleotide-regulated (HCN) channels, but does not alter gating of the plant hyperpolarization-activated channel, KAT1. Pharmacological analysis indicates that 4betaPMA exerts its effects on HCN gating via sequential activation of PKC and diacylglycerol kinase (DGK) coupled with upregulation of MAPK (mitogen-activated protein kinase) and phospholipase A2 (PLA2), but its action is independent of phosphoinositide kinase 3 (PI3K) and PI4K. Demonstration that both phosphatidic acid and arachidonic acid (AA) directly facilitate HCN gating suggests that these metabolites may serve as the messengers downstream of DGK and PLA2, respectively. 4BetaPMA-mediated suppression of the maximal HCN current likely arises from channel interaction with AA coupled with an enhanced membrane retrieval triggered by the same pathways that modulate channel gating. These results indicate that regulation of excitable cell behavior by neurotransmitter-mediated modulation of I(H) may be exerted via changes in three signaling lipids in addition to the allosteric actions of cAMP and H+(I)s.


Figures

Figure 1.
Figure 1.
The diacylglycerol-mimetic 4βPMA facilitates gating of heterologously expressed HCN1 and HCN2 channels. A, D, TEVC current families (left) and tail currents (right) from cells expressing HCN1 (A) and HCN2 (D), each recorded before (top) and after (bottom) incubation with 200 nm 4βPMA (HCN1 for 30 min; HCN2 for 10 min). The cell expressing HCN1 (A) was stepped to +20 mV for 500 ms immediately before the 3 s activation step to deactivate channels open at the holding potential in the presence of 4βPMA. B, E, Current–voltage relationships of cells shown in A and D. C, F, Steady-state activation curves constructed from the tail currents (It) as a function of the maximal tail current (Itmax) shown in A and D. Fits of the Boltzmann function are superimposed.
Figure 2.
Figure 2.
4βPMA acts via a high-affinity, stereoselective site to modify HCN channel gating. A, V1/2 of HCN1 as a function of time in the absence or presence of 4βPMA, 4αPMA, or DMSO vehicle. The V1/2 in 4βPMA was significantly different (p < 0.001) from control and DMSO vehicle groups at all concentrations and times except 2 nm at 10 min. However, control, DMSO, and 4αPMA populations were not different from each other (p = 0.28–0.93) at any time. The number of determinations per point was between 4 and 97. B, ΔV1/2 as a function of 4βPMA concentration. Data are from A and are fit with the Hill equation. C, V1/2 versus maximal tail-current amplitude for HCN1. Data from 97 control recordings and 35 cells recorded after 10 min of incubation in 200 nm 4βPMA. Symbols outlined in, and linked by, red lines are paired recordings obtained before and after incubation with 4βPMA. Solid black lines are linear regressions through the control and 200 nm 4βPMA data. Error bars represent SEM.
Figure 3.
Figure 3.
4βPMA facilitation of HCN gating is not mediated by cAMP or protons acting at their allosteric sites. A, B, TEVC current families (left) and tail currents (right) recorded from cAMP/H+I-uncoupled HCN1-REHR (A) and HCN2-REHR (B) channels before (top) or after (bottom) 30 min of incubation with 200 nm 4βPMA. C, Steady-state activation curves constructed from cells expressing HCN1-REHR (left) or HCN2-REHR (right) after 30 min of incubation in the absence or presence of 200 nm 4βPMA, 200 nm 4αPMA, or DMSO vehicle. The number of cells per condition is as follows: control, 19 and 226; 4βPMA, 8 and 81; 4αPMA, 6 and 5; and DMSO vehicle, 5 and 38, for HCN1-REHR and HCN2-REHR, respectively. D, ΔV1/2 in response to 200 nm 4βPMA as determined by the difference in the means of the treated and untreated populations for wild-type, RE, and REHR channels. In each case, the difference between the 4βPMA population and the paired control conditions (untreated, DMSO, and 4αPMA) was significant (p < 0.005), whereas the controls were not different from each other (p = 0.20–0.82; data not shown, but see overlapping activation curves in C). Error bars represent SEM.
Figure 4.
Figure 4.
Deletion mapping reveals that the conserved transmembrane core of HCN channels is sufficient for 4βPMA facilitation. Left, V1/2 for HCN1 (top) and HCN2 (bottom) and mutants thereof after 30 min of incubation in the absence (○) or presence (•) of 200 nm 4βPMA. Drug-treated values were different from the control (p < 0.005). Right, ΔV1/2 relative to control (top data point and dashed reference line). Numbers on the right are n values. Error bars represent SEM.
Figure 5.
Figure 5.
4βPMA facilitation of HCN channel gating requires an intact cellular environment. A, Experimental paradigm. Patches containing HCN1-ΔNvΔC were excised into the Mg-containing intracellular solution. IV indicates collection of current–voltage records shown in B. The bottom time ticks show when ΔV1/2 APP protocol was executed. Asterisks indicate times when current records shown in D and E were obtained. Black bar indicates perfusion with 200 nm 4βPMA. B, Current records (left) and tail currents (right) before (top) and after (bottom) exposure to 200 nm 4βPMA. C, Steady-state activation curves constructed the tail currents (It) as a function of the maximal tail current (It max) obtained from the records shown in B. Fits of the Boltzmann equation are superimposed. D, ΔV1/2 APP voltage protocol (top) and representative current records (bottom) obtained before (gray) and after (black) perfusion with 200 nm 4βPMA obtained from same patch as in B and C at the times indicated by the asterisks in A. E, Tail currents from sweeps shown in D. F, Mean values of ΔV1/2 APP determined in five patches recorded as shown in A–E. Error bars represent SEM.
Figure 6.
Figure 6.
4βPMA facilitation of HCN gating is abolished by preincubation with the pan-PKC inhibitor Ro31-8220, but elimination of phosphorylatable residues in the conserved channel core does not blunt the response. A, Mean V1/2 (bottom) and ΔV1/2 (top; obtained by subtraction of the means in the bottom panel) of HCN1 preincubated with Ro31-8220 for 6 h before 10 min of incubation in the absence (○) or presence (•) of 200 nm 4βPMA. V1/2 in 0.3, 1, 3, or 10 μm Ro31-8220 was not different from the untreated control (p ∼ 0.67, 0.97, 0.85, and 0.62, respectively). V1/2 after 4βPMA was significantly different from paired incubations in 0 and 0.3 μm Ro31-8220 (p < 0.0005 and ∼0.01, respectively) but not after incubation with 1, 3, or 10 μm PKC inhibitor (p ∼ 0.08, 0.29, and 0.65). Suppression of the 4βPMA response by Ro31-8220 is fit with the Hill equation. The number of cells in each population is shown next to symbols in the bottom panel. B, Serine, threonine (S/T; black circles) and tyrosine (Y; gray circles) residues within the minimal channel HCN1-ΔNvΔC. Residues likely to be exposed to the cytoplasm are shown boxed in green and are numbered according to the cassette followed by position within that cassette. Residues in A2 are in consensus PKC sites. S/T/Y residues in a cassette were simultaneously mutated S/T to N and Y to F. Where multiple mutations were not tolerated (no detectable channel activity), each S/T/Y in a cassette was mutated individually. At two positions (A3:3 and C1:2), data are from constructs bearing alanine rather than asparagine, because the latter mutants did not form functional channels. C, Left, V1/2 after 30 min of incubation in the absence (○) or presence (•) of 200 nm 4βPMA. Right, ΔV1/2 determined as difference of means. Facilitation in the presence of 4βPMA compared with paired controls (p < 0.05) was not different from that observed with the parental channel, HCN1-ΔNvΔC (top data point and blue dashed reference line). wt, Wild-type HCN1-ΔNvΔC. Error bars represent SEM.
Figure 7.
Figure 7.
DGK, MAPK, and PLA2, but not PIK or PLD, contribute to 4βPMA modulation of HCN channel gating. A, ΔV1/2 of HCN2-REHR elicited by 200 nm 4βPMA (30 min) after preincubation in the absence (gray bars) or presence (black bars) of the indicated inhibitor or combination thereof (wortmannin, 10 μm for 60 min; 1-butanol, 30 mm for 60 min; OPC, 3 μm for 60 min; AACOCF3, 50 μm for 60 min; R59949, 30 μm for 60 min; SB-202190, 50 μm for 120 min; U-0126, 50 μm for 120 min). The dashed and dotted lines represent the mean and SEM of the depolarization elicited by 200 nm 4βPMA determined across all recordings in which HCN2-REHR-expressing cells were exposed to 200 nm 4βPMA (81 separate cells). Numbers in each experimental group are indicated next to the appropriate rows. Asterisks indicate that the value determined in the presence of inhibitor is significantly different from its paired control (p < 0.05). B, ΔV1/2 in the presence of inhibitor normalized to the maximal response seen in the absence of inhibitor in paired control recordings. C, Suppression of HCN2-REHR current in response to 200 nm 4βPMA (30 min) after preincubation in the absence (gray bars) or presence (black bars) of the indicated inhibitor or combination thereof. Concentrations and times are as in A. Dashed and dotted lines and asterisks have the same meaning as in A. D, Suppression of current in the presence of inhibitor normalized to the maximal response seen in the absence of inhibitor in paired control recordings (ΔIMAX plus inhibitor/ΔIMAX minus inhibitor). Error bars represent SEM.
Figure 8.
Figure 8.
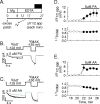
Phosphatidic acid and arachidonic acid, the products of DGK and PLA2, respectively, both directly facilitate HCN gating. A, Schematic representation of the experimental paradigm. Data were obtained from inside-out patches excised into a Mg-containing intracellular solution from cells expressing HCN2. IV and bottom time ticks indicate determination of full activation curve and execution of the ΔV1/2 APP protocol, respectively. Black bar indicates perfusion with 5 μm PA or AA. B, C, Voltage protocol (top) and representative sweeps (bottom) acquired before (gray traces) and after (black traces) inclusion of 5 μm PA (B) or AA (C). D, E, Mean values of ΔV1/2 APP (top) and maximal current amplitude relative to the initially determined value (bottom) determined from seven (D) and six (E) separate recordings as shown in B and C. Open circles indicate absence of PA or AA; filled circles indicate presence of PA or AA. Error bars represent SEM.
Figure 9.
Figure 9.
Activation of the plant hyperpolarization-activated channel KAT1 is insensitive to 4βPMA. A, TEVC current families (left) and tail currents (right) recorded from a cell expressing KAT1 before (top) and after (bottom) incubation with 200 nm 4βPMA for 30 min. B, Top, I–V curves constructed from records shown in A. Bottom, Mean steady-state activation curves for KAT1 before (V1/2 = −107.8 ± 4.8 mV; n = 12) and after (V1/2 = −115.2 ± 5.7 mV; n = 6) 30 min of incubation in 200 nm 4βPMA. Data are fit with the Boltzmann equation. The hyperpolarization was not statistically significant (p = 0.34).

Similar articles

Cited by

References

    1. Anderson DH. Role of lipids in the MAPK signaling pathway. Prog Lipid Res. 2006;45:102–119. - PubMed
    1. Andresen BT, Rizzo MA, Shome K, Romero G. The role of phosphatidic acid in the regulation of the Ras/MEK/Erk signaling cascade. FEBS Lett. 2002;531:65–68. - PubMed
    1. Besana A, Robinson RB, Feinmark SJ. Lipids and two-pore domain K+ channels in excitable cells. Prostaglandins Other Lipid Mediat. 2005;77:103–110. - PubMed
    1. Bol GF, Gros C, Hulster A, Bosel A, Pfeuffer T. Phorbol ester-induced sensitisation of adenylyl cyclase type II is related to phosphorylation of threonine 1057. Biochem Biophys Res Commun. 1997;237:251–256. - PubMed
    1. Bollag WB, Zhong X, Dodd ME, Hardy DM, Zheng X, Allred WT. Phospholipase d signaling and extracellular signal-regulated kinase-1 and -2 phosphorylation (activation) are required for maximal phorbol ester-induced transglutaminase activity, a marker of keratinocyte differentiation. J Pharmacol Exp Ther. 2005;312:1223–1231. - PubMed

Publication types

MeSH terms

LinkOut - more resources