Comparative Study
. 2007 Mar 14;27(11):2866-75.
doi: 10.1523/JNEUROSCI.4970-06.2007.

Natural oligomers of the Alzheimer amyloid-beta protein induce reversible synapse loss by modulating an NMDA-type glutamate receptor-dependent signaling pathway

Affiliations
Comparative Study

Natural oligomers of the Alzheimer amyloid-beta protein induce reversible synapse loss by modulating an NMDA-type glutamate receptor-dependent signaling pathway

Ganesh M Shankar et al. J Neurosci. .

Abstract

Alzheimer's disease (AD) is characterized by decreased synapse density in hippocampus and neocortex, and synapse loss is the strongest anatomical correlate of the degree of clinical impairment. Although considerable evidence supports a causal role for the amyloid-beta protein (Abeta) in AD, a direct link between a specific form of Abeta and synapse loss has not been established. We demonstrate that physiological concentrations of naturally secreted Abeta dimers and trimers, but not monomers, induce progressive loss of hippocampal synapses. Pyramidal neurons in rat organotypic slices had markedly decreased density of dendritic spines and numbers of electrophysiologically active synapses after exposure to picomolar levels of soluble oligomers. Spine loss was reversible and was prevented by Abeta-specific antibodies or a small-molecule modulator of Abeta aggregation. Mechanistically, Abeta-mediated spine loss required activity of NMDA-type glutamate receptors (NMDARs) and occurred through a pathway involving cofilin and calcineurin. Furthermore, NMDAR-mediated calcium influx into active spines was reduced by Abeta oligomers. Partial blockade of NMDARs by pharmacological antagonists was sufficient to trigger spine loss. We conclude that soluble, low-n oligomers of human Abeta trigger synapse loss that can be reversed by therapeutic agents. Our approach provides a quantitative cellular model for elucidating the molecular basis of Abeta-induced neuronal dysfunction.


Figures

Figure 1.
Figure 1.
Naturally secreted Aβ oligomers, but not monomers, decrease dendritic spine density in hippocampal pyramidal neurons. A, Aβ was immunoprecipitated with polyclonal antibody R1282 (Walsh et al., 2000) from SCM containing reconstituted SEC fractions enriched in Aβ oligomers or monomers. Immunoprecipitation was done before (pre) and after (post) a 2 d incubation with organotypic slices. The blank IP lane (far left) shows the results of a similar analysis of control SCM. The faint monomer in this lane represents a well described artifact of the presence in the R1282 antiserum of small amounts of the synthetic human Aβ peptide used to immunize this rabbit (Walsh et al., 2000, 2002). T, Trimer; D, dimer; M, monomer. B, Representative images of apical dendrites of pyramidal cells in organotypic hippocampal slice cultures treated with control SCM, SCM with added Aβ monomers, or SCM with added Aβ oligomers for 5, 10, and 15 d. Scale bar, 5 μm. C, Quantification of spine density (top) and spine length (bottom) in apical dendrites of neurons treated as in B. *p < 0.05 compared with control for each treatment duration. D, Image of a representative dendrite (left) and average spine density (right) for neurons incubated with SCM plus Aβ oligomers for 10 d followed by 5 d of control SCM. For comparison, the shaded regions (right) show the range of spine densities (mean ± 2 SEM) presented in Figure 1C for neurons incubated for 15 d in control SCM (yellow) or in the presence of Aβ oligomers (red). *p < 0.05 compared with oligomer-treated cells. E, Summary of spine density in mature neurons treated with SCM alone for 15 d followed by a 5 d exposure to Aβ oligomers (oligomer) or continued treatment for 5 more days in SCM (control). *p < 0.05 compared with control.
Figure 2.
Figure 2.
Exposure to naturally secreted Aβ oligomers reduces the number and strength of active excitatory synapses in the hippocampus. A, Membrane capacitance (Cm) (left), resting membrane input resistance (Rin) (middle), and series resistance (Rs) (right) of control and Aβ oligomer-treated neurons. *p < 0.05 compared with control (n = 6 cells in each condition). Error bars indicate SEM. B, Representative traces of mEPSCs recorded at a holding potential of −70 mV from control and Aβ oligomer-treated neurons. C, Cumulative distributions of the IMI (left) and mEPSC amplitude (right) for control (black) or Aβ oligomer-treated (red) neurons. The curve for each condition was generated by pooling 300 randomly chosen mEPSC amplitudes or IMIs from each neuron. The differences between conditions for the displayed mEPSC and IMI cumulative distributions are statistically significant at p < 0.05 by KS test. The increased IMI and decreased mEPSC amplitude in Aβ oligomer-treated cells relative to controls was found in each of 1000 repetitions of this analysis.
Figure 3.
Figure 3.
Effects of Aβ oligomers on spine density are prevented by an antibody against human Aβ and by the scyllo enantiomer of myo-inositol (AZD-103). A, Representative images of apical dendrites of neurons in slices treated for 5 d with control SCM and the 6E10 antibody (SCM + 6E10), Aβ oligomers and 6E10 (Olig + 6E10), Aβ oligomers and boiled 6E10 (SCM + boiled 6E10), Aβ oligomers and scyllo-inositol (Olig + scyllo), or Aβ oligomers and the inactive stereoisomer chiro-inositol (Olig + chiro). Scale bar, 5 μm. B, Summary of dendritic spine density (top) and spine length (bottom) for the conditions shown in A. For comparison, the shaded areas show the range (average ± 2 SEM) for each parameter in control conditions (yellow) or in the presence of Aβ oligomers (red) as presented in Figure 1. *,#p < 0.05 compared with control and Aβ oligomer-treated cells, respectively.
Figure 4.
Figure 4.
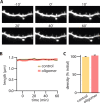
Aβ oligomer-induced reduction of spine density requires prolonged exposure. A, Time-lapse images of a representative dendrite of a neuron taken at the indicated times (in minutes) relative to the application of Aβ oligomers (0′). B, Average spine length as a function of time after Aβ oligomer exposure (red) or sham treatment (black). The shaded regions indicate the averages ± SEMs of spine lengths in Aβ oligomer-exposed (red) or control (yellow) neurons. C, Average spine density in control (yellow) and Aβ oligomer-exposed (red) neurons at t = 60 min expressed as a percentage of the initial spine density at t = −10 min. Error bars indicate SEM.
Figure 5.
Figure 5.
Loss of dendritic spines induced by Aβ oligomers requires NMDAR activity and is mimicked by partial blockade of NMDARs. A, Representative images of apical dendrites of neurons treated for 10 d with control SCM, 100 nm α-BTX, or 20 μm CPP in the absence or presence of Aβ oligomers. Scale bar, 5 μm. B, Summary of dendritic spine density for the conditions shown in A (left) and for neurons treated with 200–400 nm CPP (right). On the right, the spine density (mean ± 2 SEM) for 10 d control (yellow) or Aβ oligomer (red) treatments are replotted in the shaded regions for comparison. *,#p < 0.05 compared with control and Aβ oligomer-treated cells, respectively. Error bars indicate SEM. C, Image of a spiny region of apical dendrite of a CA1 hippocampal pyramidal neuron in an acute brain slice filled with 10 μm Alexa-594 (red fluorescence) and 300 μm Fluo-5F (green fluorescence). D, Fluorescence collected in a line scan, as indicated by the dashed line in C, that intersects the spine head (sp) and neighboring dendrite (den) during glutamate uncaging onto the spine head. The arrowheads in C and D indicate the location and timing, respectively, of a 500 μs pulse of 725 nm laser light used to trigger two-photon-mediated photolysis of MNI-glutamate. The increase in green fluorescence indicates increased intracellular [Ca]. The white traces show the uEPSP (top; amplitude, 0.50 mV) and the quantification of the fluorescence transient in the spine head (bottom; 4.9% ΔG/Gsat). E, ΔGuEPSP/Gsat (bottom) measured in control conditions (black) and in the presence of Aβ oligomers (left; red) or monomers (right; red). The solid line and shaded regions depict the mean and the mean ± SEM, respectively. F, Amplitudes of the uEPSP (left) and uncaging-evoked spine head Ca transients (right) measured in the conditions shown in E. *p < 0.05 compared with control. Error bars indicate SEM.
Figure 6.
Figure 6.
Aβ oligomer-induced decreases in spine density require active calcineurin and cofilin. A, Images of representative dendrites from neurons cotransfected with cofilin-S3D and GFP cultured in control SCM (cof-S3D) or in the presence of Aβ oligomers (Olig + cof-S3D) for 10 d. Scale bar, 5 μm. B, Summary of spine density for the conditions shown in A. Summary spine density data from Figure 5 (mean ± 2 SEM) for 10 d control (yellow) or Aβ oligomer (red) treatments are presented as shaded regions for comparison. *p < 0.05 compared with control cells. C, Images of representative dendrites from neurons incubated in control SCM for 9 d followed by treatment for 24 h with Aβ oligomers (Olig), 1 μm FK506 (FK506), or Aβ oligomers and 1 μm FK506 (Olig + FK506). Scale bar, 5 μm. D, Average spine density for neurons in the conditions shown in C. For comparison, the shaded regions show the range of spine densities (mean ± 2 SEM) presented in Figure 5 for neurons incubated for 10 d in control SCM (yellow) or in the presence of Aβ oligomers (red). *p < 0.05 compared with control and 24 h Aβ oligomer-treated cells, respectively.
Figure 7.
Figure 7.
Proposed pathways that regulate spine density and that are affected by Aβ oligomers, based on the results of this study. Ca influx through synaptic NMDARs can activate at least two pathways that regulate spine density. On the left side, high levels of Ca accumulation, such as those reached during tetanic or suprathreshold synaptic stimulation, induce LTP via a calcium/calmodulin-dependent protein kinase II (CAMKII)-dependent pathway (for review, see Nicoll and Malenka, 1999). LTP-inducing stimuli also trigger enlargement of dendritic spines and growth of new spines in a NMDAR- and CAMKII-dependent manner (Engert and Bonhoeffer, 1999; Maletic-Savatic et al., 1999; Jourdain et al., 2003; Matsuzaki et al., 2004; Nagerl et al., 2004). Introduction of active CAMKII in neurons is sufficient to induce new spine growth (Jourdain et al., 2003). In the right side pathway, low levels of Ca accumulation, such as those reached during low-frequency subthreshold stimulation, induce LTD through a calcineurin-dependent pathway (for review, see Malenka and Bear, 2004). LTD-inducing stimuli also lead to spine shrinkage via an NMDAR/calcineurin/cofilin-dependent pathway and spine retraction through an NMDAR-dependent pathway (Nagerl et al., 2004; Zhou et al., 2004). The calcineurin and cofilin dependence of LTD-associated spine retraction have not been examined. In this model, full block of NMDARs interrupts both pathways leading to no net spine loss. Partial block of NMDARs favors activation of the right side pathway, LTD induction, and loss of spines. In addition, multiple factors (‘A,’ ‘B,’ ‘C,’ and ‘D’) act independently of NMDARs, CAMKII, and calcineurin to regulate cofilin and spine density. We find that soluble Aβ oligomers decrease spine density in an NMDAR/calcineurin/cofilin-dependent manner, consistent with activation of the pathway shown on the right. Aβ oligomers reduce NMDAR-dependent Ca transients, possibly shifting stimuli that normally activate the left pathway to instead activate those on the right. This might occur through direct interaction of Aβ with NMDARs or by first activating unknown factors (‘X’) that may lead to inhibition of NMDAR-mediated synaptic Ca influx. Aβ may also facilitate NMDAR-dependent activation of calcineurin via additional pathways. The blue lines indicate levels at which soluble Aβ oligomers may modulate the pathway, and the red lines indicate elements of the pathway tested in this study.

Similar articles

Cited by

References

    1. Bloodgood BL, Sabatini BL. Nonlinear regulation of unitary synaptic signals by CaV(2.3) voltage-sensitive calcium channels located in dendritic spines. Neuron. 2007;53:249–260. - PubMed
    1. Carter AG, Sabatini BL. State-dependent calcium signaling in dendritic spines of striatal medium spiny neurons. Neuron. 2004;44:483–493. - PubMed
    1. Chen QS, Wei WZ, Shimahara T, Xie CW. Alzheimer amyloid beta-peptide inhibits the late phase of long-term potentiation through calcineurin-dependent mechanisms in the hippocampal dentate gyrus. Neurobiol Learn Mem. 2002;77:354–371. - PubMed
    1. Cleary JP, Walsh DM, Hofmeister JJ, Shankar GM, Kuskowski MA, Selkoe DJ, Ashe KH. Natural oligomers of the amyloid-beta protein specifically disrupt cognitive function. Nat Neurosci. 2005;8:79–84. - PubMed
    1. Cummings JA, Mulkey RM, Nicoll RA, Malenka RC. Ca2+ signaling requirements for long-term depression in the hippocampus. Neuron. 1996;16:825–833. - PubMed

Publication types

Substances