Comparative Study
. 2007 Mar 14;27(11):2987-98.
doi: 10.1523/JNEUROSCI.5072-06.2007.

Time course of precision in smooth-pursuit eye movements of monkeys

Affiliations
Comparative Study

Time course of precision in smooth-pursuit eye movements of monkeys

Leslie C Osborne et al. J Neurosci. .

Abstract

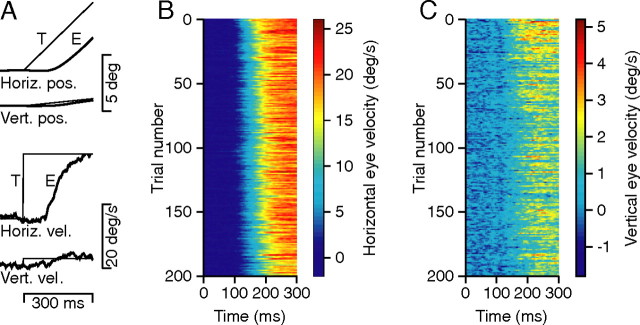
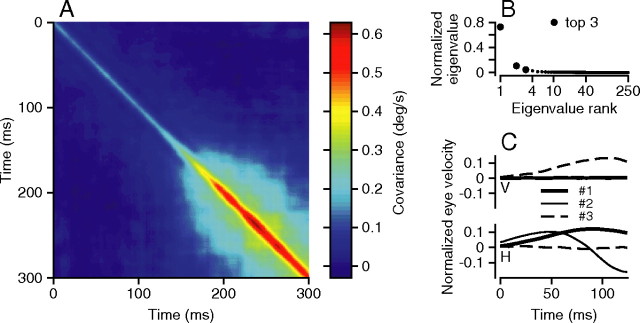
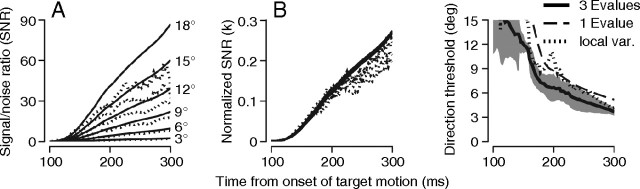
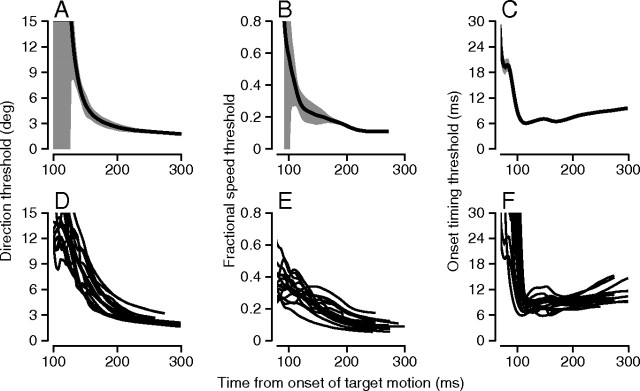
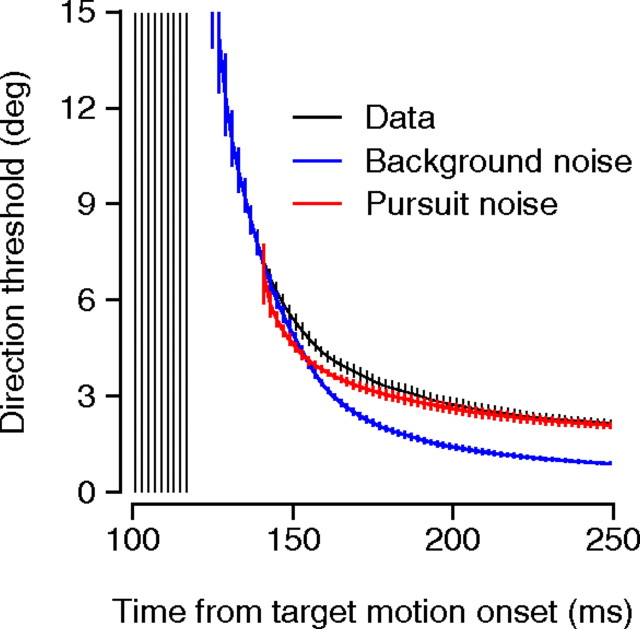
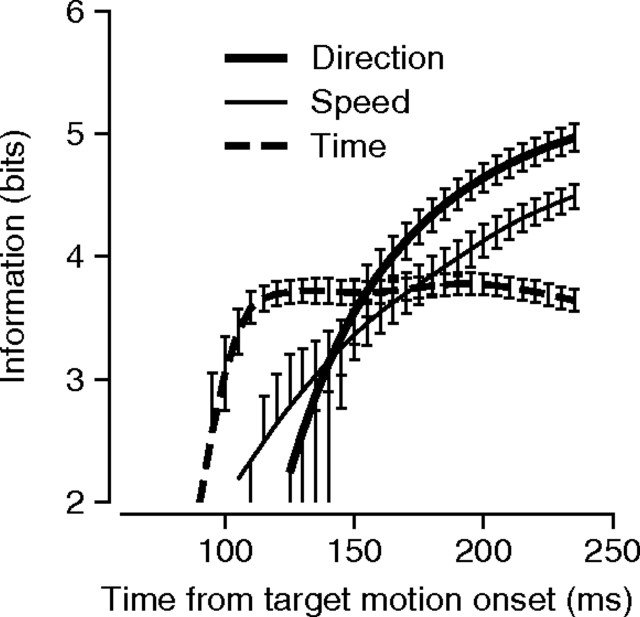
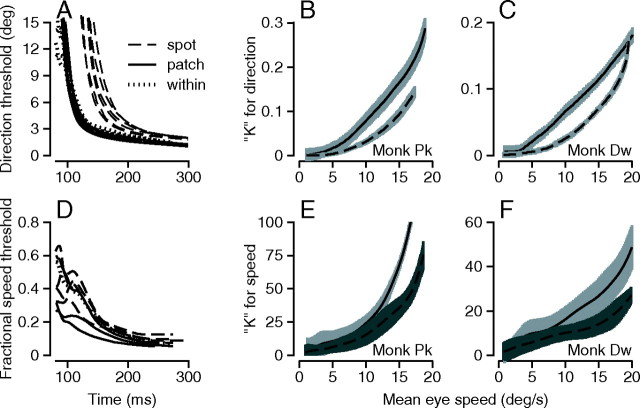
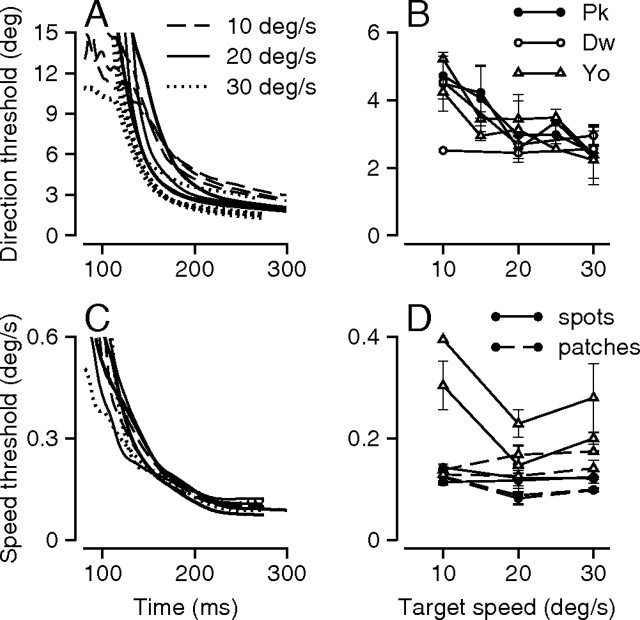
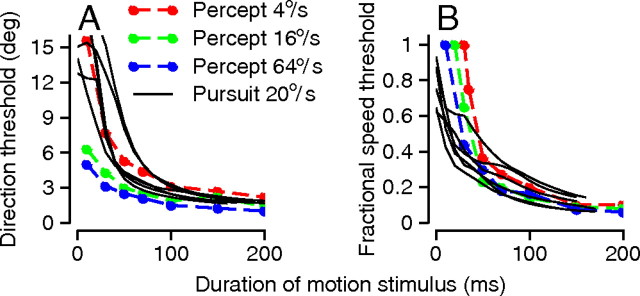
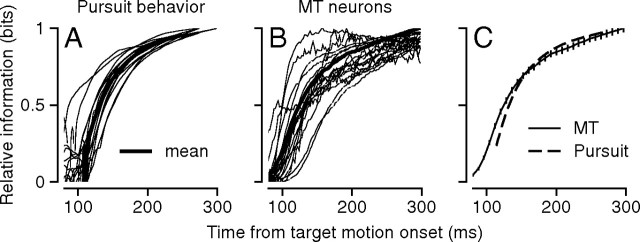
To evaluate the nature and possible sources of variation in sensory-motor behavior, we measured the signal-to-noise ratio for the initiation of smooth-pursuit eye movements as a function of time and computed thresholds that indicate how well the pursuit system discriminates small differences in the direction, speed, or time of onset of target motion. Thresholds improved rapidly as a function of time and came close to their minima during the interval when smooth eye movement is driven only by visual motion inputs. Many features of the data argued that motor output and sensory discrimination are limited by the same noise source. Pursuit thresholds reached magnitudes similar to those for perception: <2-3 degrees of direction, approximately 11-15% of target speed, and 8 ms of change in the time of onset of target motion. Pursuit and perceptual thresholds had similar dependencies on the duration of the motion stimulus and showed similar effects of target speed. The evolution of information about direction of target motion followed the same time course in pursuit behavior and in a previously reported sample of neuronal responses from extrastriate area MT. Changing the form of the sensory input while keeping the motor response fixed had significant effects on the signal-to-noise ratio in pursuit for direction discrimination, whereas holding the sensory input constant while changing the combination of muscles used for the motor output did not. We conclude that noise in sensory processing of visual motion provides the major source of variation in the initiation of pursuit.


Figures

Figure 1.
Figure 1.
Example of trial-by-trial variation in pursuit eye movements for one direction of target motion at 20°/s in a single experiment. A, Horizontal and vertical components of eye (E) movement from a single trial for target (T) motion in a polar direction 6° up relative to rightward. From top to bottom, traces are superimposed horizontal target and eye position (Horiz. pos.), superimposed vertical target and eye position (Vert. pos.), superimposed horizontal target and eye velocity (Horiz. vel.), and superimposed vertical target and eye velocity (Vert. vel.). B, C, Density plots in which the colors indicate horizontal and vertical eye velocity and time runs from left to right; each line of the density plots shows eye movements from a different response to the same target motion. Data are aligned on the onset of target motion.
Figure 2.
Figure 2.
Analysis of covariance of noise in pursuit eye movements. A, Covariance matrix derived from vertical eye velocity for a single experiment in which a spot target moved at 20°/s in 1 of 14 different directions around a central direction that was horizontal. Each pixel uses a color code to indicate the covariance of eye velocity at a pair of times indicated by the values along the x- and y-axes. Target motion began at time 0, and pursuit began ∼100 ms later. B, C, Analysis of the full covariance matrix (horizontal and vertical components of eye velocity) in the first 125 ms of pursuit. B, Ranking of the 250 eigenvalues of the covariance matrix. Eigenvalues were normalized so that their sum was 1. Large symbols indicate the three largest eigenvalues. C, Time course of the horizontal (H) and vertical (V) components of the eigenvectors corresponding to the three largest eigenvalues. Note that, by definition, all eigenvectors are normalized so that they have a length of 1.
Figure 3.
Figure 3.
Calculation of threshold for discriminating small differences in direction of target motion for an experiment in which the target moved in 14 different directions at 3° intervals around a central direction that was horizontal. A, Time course of the mean SNR for all pairs of target motions sorted according to directional spacing. B, Time course of the value of Kθ for the data in A. In A and B, each curve shows a different directional spacing; continuous and dotted curves show the SNR obtained from the eigenvectors with the three largest eigenvalues of the covariance matrix (Eq. 4) and from local mean and variance (Eq. 3). C, Time course of directional threshold for the data shown in A and B. The gray error surface indicates SDs of threshold estimates for the solid curve; solid, dashed, and dotted curves show estimates of thresholds made with the three largest eigenvalues of the covariance matrix, the single largest eigenvalue, and local mean and variance (var.), respectively. Numbers of the time axes refer to the time of onset of target motion. Data are from monkey Qu.
Figure 4.
Figure 4.
Summary of time course of thresholds for discrimination of small differences in target direction (A, D), speed (B, E), and onset time (C, F). A–C show examples from single experiments in monkey Pk, and D–F superimpose curves obtained across many experiments in multiple monkeys. Thresholds for direction are given in degrees, thresholds for speed are given as a fraction of the central target speed, and thresholds for onset time discrimination are in milliseconds. Numbers on the time axes refer to the time of onset of target motion. The gray surfaces in A–C indicate ±1 SD of threshold.
Figure 5.
Figure 5.
Quantitative explanation for the decrease in directional threshold for pursuit over time. Each curve plots direction threshold as a function of time from the onset of target motion. The black curve shows the data for a representative experiment (see Fig. 4A). Blue and red curves show predicted thresholds when the noise was assumed to remain the same as during fixation and when noise was derived from that present during the initiation of pursuit with fixation noise subtracted (Eq. 12).
Figure 6.
Figure 6.
Time course of the information capacity of the pursuit system based on values of threshold averaged across multiple experiments in monkeys Pk, Dw, and Yo. Bold continuous, fine continuous, and dashed curves show information about the direction, speed, and onset time of target motion, respectively. Error bars indicate SDs. Numbers on the time axes refer to the time of onset of target motion.
Figure 7.
Figure 7.
Time course of directional and speed errors in pursuit. A, Each curve shows instantaneous vertical (Vert.) versus horizontal eye velocity for the first 260 ms of the responses to targets that moved in 14 different directions: rightward, leftward, and ±3, ±6, and ±9° relative to purely horizontal. Filled and open circles on each curve show the values of eye velocity 50 and 100 ms after the onset of target motion, and open squares show the actual target motions. B, Directional error of average eye motion during the first 100 ms of pursuit for the target motions shown in A. C, Time course of directional error averaged across multiple experiments in three monkeys. Filled circles, open circles, and open triangles show data from monkeys Pk, Dw, and Yo. D, Each curve shows the average horizontal (Horiz.) eye velocity for a series of target motions at 14, 16, 18, 20, 22, 24, and 26°/s. Open squares at the end of the curves indicate target velocity. E, Time course of speed error for the same target data shown in D, where speed error was computed relative to the prediction of perfect scaling of the response to target motion at the central target velocity of 20°/s (Eq. 13). The perfect horizontal trace presents the error for the central target velocity, which is, by definition, zero at all times. F, Time course of speed error averaged across multiple experiments in two monkeys. Symbols are the same as in C. In D, time is given from the onset of target motion. In B, C, E, and F, time is from the onset of pursuit.
Figure 8.
Figure 8.
Comparison of directional errors and directional thresholds across many experiments in multiple monkeys. A, Average time courses for three different monkeys. Continuous and dashed curves show mean directional error and threshold across multiple experiments as a function of time from the onset of pursuit. B, Scatter plot comparing systematic directional error and threshold 125 ms after the onset of pursuit in individual experiments. Black, red, and green curves and symbols show data from monkeys Pk, Dw, and Yo. The x-axis in A shows time relative to the onset of pursuit.
Figure 9.
Figure 9.
Effect of the form of the moving target on direction and speed thresholds. A, Time course of direction threshold for multiple experiments in monkey Pk. B, C, Time course of value of normalized SNR for direction, Kθ(t), for two monkeys, averaged across experiments. D, Time course of speed threshold for multiple experiments in monkey Pk. E, F, Time course of the value of K for speed in two monkeys, averaged across experiments. In A and D, dashed, continuous, and dotted curves show thresholds for targets that consisted of single spots, patches of moving texture, and patches of moving texture that started with motion of the texture but not its surrounding aperture. In B, C, E, and F, dashed and continuous curves show data for targets that consisted of single spots or textures. The gray regions surrounding the curves indicate SDs. All time axes show time relative to the onset of target motion. Monk, Monkey.
Figure 10.
Figure 10.
Effect of target speed on direction and speed thresholds. A, Time course of direction threshold for several experiments from monkey Pk using spot targets. B, Direction threshold 125 ms after the onset of pursuit, averaged across multiple experiments in three monkeys. C, Time course of speed threshold for several experiments from monkey Pk using spot targets. D, Speed threshold 125 ms after the onset of pursuit, averaged across multiple experiments in two monkeys. In A and C, dashed, solid, and continuous curves show threshold for target motion at 10, 20, and 30°/s. In B and D, filled circles, open circles, and open triangles show data from monkeys Pk, Dw, and Yo, with values for leftward and rightward target motion plotted separately. In D, solid and dashed lines indicate thresholds obtained with spot versus patch targets. All time axes show time relative to the onset of target motion.
Figure 11.
Figure 11.
Dependence of direction threshold on the central direction of target motion in each individual experiment. A, Spot targets. B, Patch targets. In both panels, each symbol plots data from a different individual experiment and indicates the end of a vector, where the length of the vector corresponds to the directional threshold 125 ms after pursuit onset and the angle of the vector indicates the central direction of target motion for that experiment. Different symbols denote data from different monkeys.
Figure 12.
Figure 12.
Comparison of thresholds derived from analysis of pursuit and of motion perception. A, Direction discrimination thresholds. B, Speed discrimination thresholds. Continuous black curves show mean direction thresholds from single experiments in three monkeys pursuing target motion at 20°/s. Dashed red, black, and blue curves show perceptual (Percept) thresholds for target motion at 4, 16, and 64°/s in humans. Human perceptual thresholds were taken from de Bruyn and Orban (1988) and show the mean just-noticeable difference for sequential viewings of pairs of stimuli over three human observers. Pursuit thresholds are plotted as a function of the time from the onset of pursuit, whereas perceptual thresholds are plotted as a function of the duration of the motion stimulus.
Figure 13.
Figure 13.
Comparison of time courses of information about the direction of target motion derived from the initiation of pursuit and the responses of neurons in MT. A, Information about target direction derived from direction thresholds for pursuit in three monkeys. Thin lines show results of 15 selected experiments, and the bold line shows the average across the experiments. B, Information about stimulus direction from spike count in MT. Thin lines show results from 18 randomly selected neurons in the sample from Osborne et al. (2004); bold line shows the average across all 25 neurons that encoded >0.2 bits of information about motion direction. C, Comparison of the time courses of the population averages of information from pursuit (dashed line) and from MT responses (continuous line). In all panels, values for each experiment or neuron were normalized to the maximum number of bits of information during the time interval shown. All time axes are relative to the onset of target motion.

Similar articles

Cited by

References

    1. Barlow HB. Retinal noise and absolute threshold. J Opt Soc Am. 1956;46:634–639. - PubMed
    1. Barlow HB. Critical limiting factors in the design of the eye and visual cortex. Proc R Soc Lond B Biol Sci. 1981;212:1–34. - PubMed
    1. Bialek W, Rieke F, de Ruyter van Steveninck RR, Warland D. Reading a neural code. Science. 1991;252:1854–1857. - PubMed
    1. Born RT, Groh JM, Zhao R, Lukasewycz SJ. Segregation of object and background motion in visual area MT: effect of microstimulation on eye movements. Neuron. 2000;26:725–734. - PubMed
    1. Broussard DM, Bronte-Stewart HM, Lisberger SG. Expression of motor learning in the response of the primate vestibuloocular reflex pathway to electrical stimulation. J Neurophysiol. 1992;67:1493–1508. - PubMed

Publication types

LinkOut - more resources