Comparative Study
. 2007 Mar 14;27(11):2999-3009.
doi: 10.1523/JNEUROSCI.4913-06.2007.

Status epilepticus-induced somatostatinergic hilar interneuron degeneration is regulated by striatal enriched protein tyrosine phosphatase

Affiliations
Comparative Study

Status epilepticus-induced somatostatinergic hilar interneuron degeneration is regulated by striatal enriched protein tyrosine phosphatase

Yun-Sik Choi et al. J Neurosci. .

Abstract

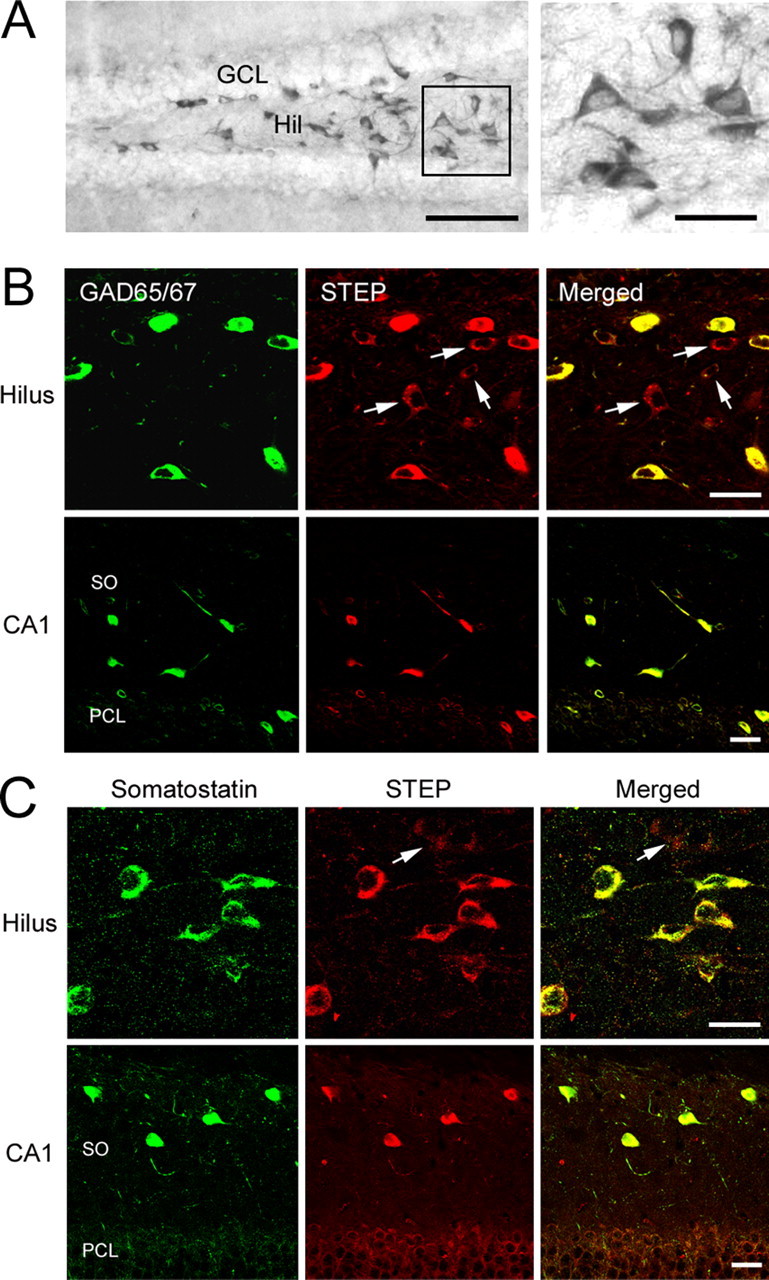
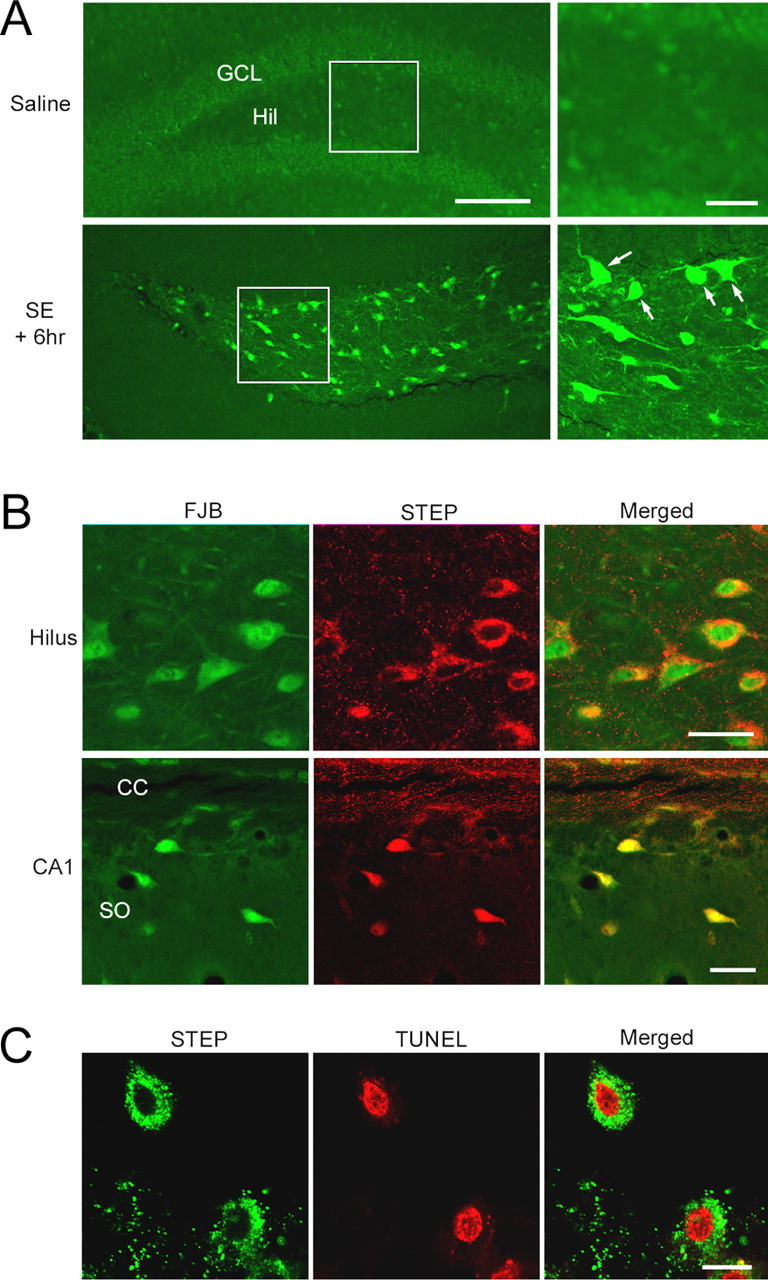
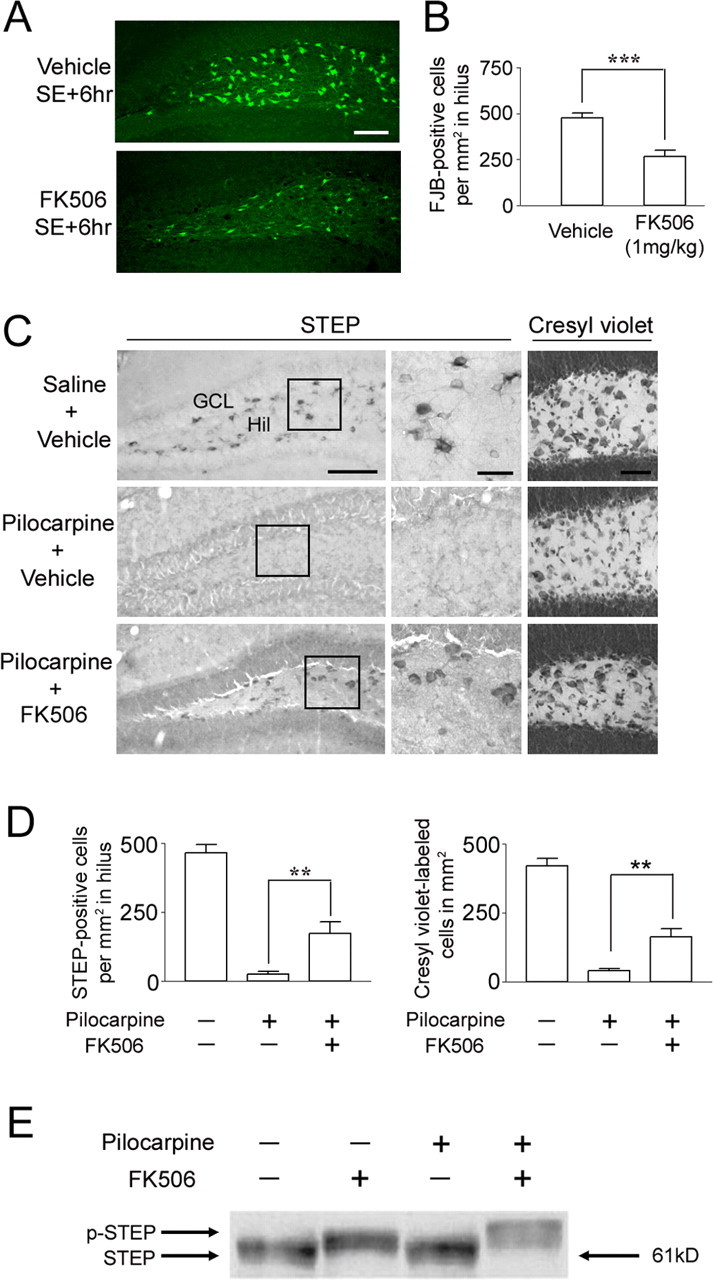
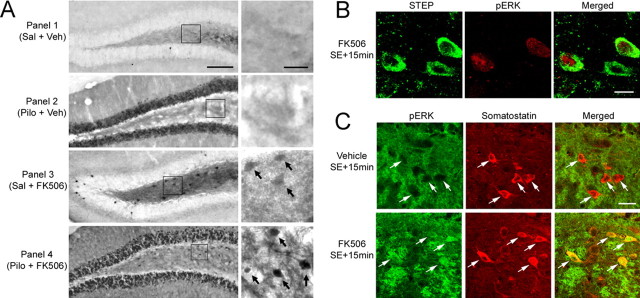
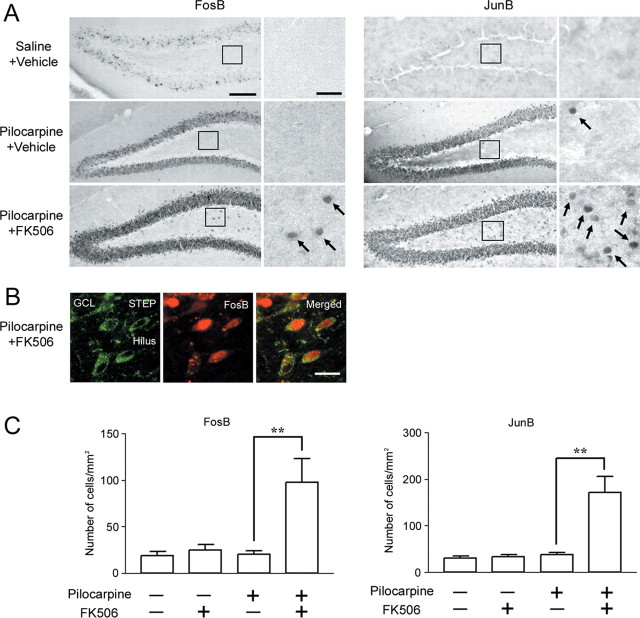
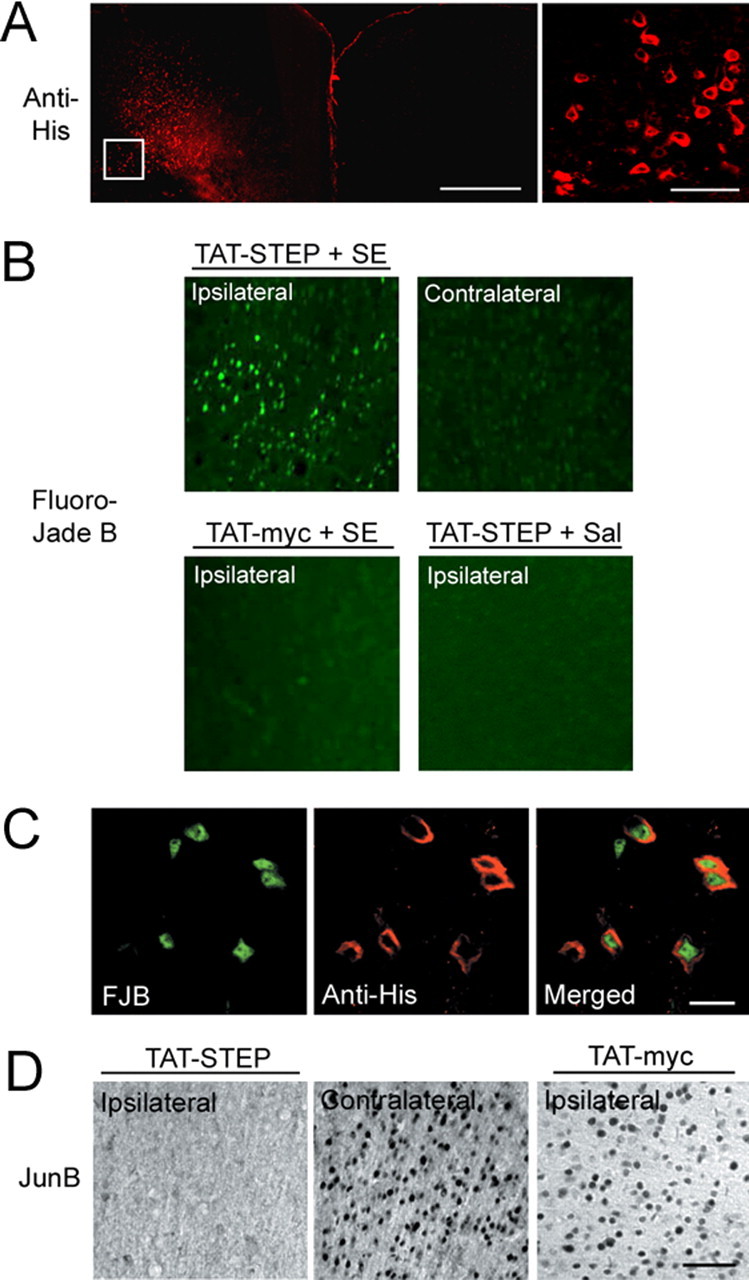
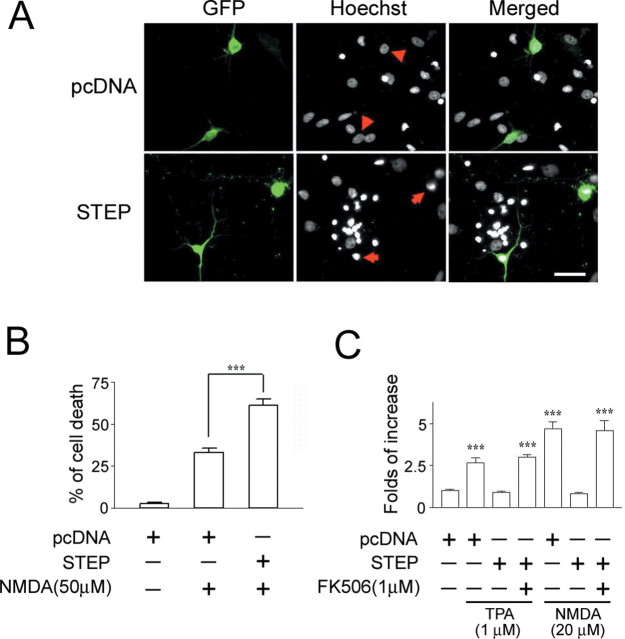
Excitotoxic cell death is one of the precipitating events in the development of temporal lobe epilepsy. Of particular prominence is the loss of GABAergic hilar neurons. Although the molecular mechanisms responsible for the selective vulnerability of these cells are not well understood, activation of the extracellular signal-regulated kinase/mitogen-activated protein kinase (ERK/MAPK) pathway has been implicated in neuroprotective responses to excitotoxicity in other neuronal populations. Here, we report that high levels of the striatal-enriched protein tyrosine phosphatase (STEP), a key regulator of ERK/MAPK signaling, are found in vulnerable somatostatin-immunoreactive hilar interneurons. Under both control conditions and after pilocarpine-induced status epilepticus (SE), ERK/MAPK activation was repressed in STEP-immunoreactive hilar neurons. This contrasts with robust SE-induced ERK/MAPK activation in the granule cell layer of the dentate gyrus, a cell region that does not express STEP. During pilocarpine-induced SE, in vivo disruption of STEP activity allowed activation of the MAPK pathway, leading to immediate-early gene expression and significant rescue from cell death. Thus, STEP increases the sensitivity of neurons to SE-induced excitotoxicity by specifically blocking a latent neuroprotective response initiated by the MAPK pathway. These findings identify a key set of signaling events that render somatostatinergic hilar interneurons vulnerable to SE-induced cell death.


Figures

Figure 1.
Figure 1.
STEP is expressed in GABAergic hilar interneurons. A, DAB-based immunohistochemical labeling revealed marked STEP expression in the hilus (Hil). Note the lack of STEP staining in the GCL. The boxed region is magnified and shown on the right. B, Top row, Immunofluorescent double labeling for STEP and GAD65/67 revealed that STEP is expressed in GABAergic hilar interneurons. Bottom row, STEP is also expressed in GAD65/67-positive neurons in the stratum oriens of CA1. Arrows indicate cells expressing STEP but not GAD65/67. C, Double labeling shows that somatostatinergic interneurons express STEP in the hilus (top row) as well as in the stratum oriens of CA1 (bottom row). Arrow denotes a somatostatin-negative cell weakly expressing STEP. Scale bars: A, 100 μm (low-magnification image) and 25 μm (high-magnification image); B, C, 20 μm. SO, Stratum oriens; PCL, pyramidal cell layer.
Figure 2.
Figure 2.
Pilocarpine-induced SE elicits cell death in the hilus. A, Mice were given injections of either pilocarpine (325 mg/kg, i.p.) or saline (control), and brain sections were stained with Fluoro-Jade B, a fluorescent marker of dead and dying cells. Mice were killed 6 h after SE onset. Fluoro-Jade B labeling was observed specifically in the hilus (Hil). In contrast, cell death was not observed in the GCL. Boxed regions are shown magnified on the right. Arrows denote dead/dying cells. B, Double labeling revealed that Fluoro-Jade B (FJB) -labeled cells in the hilus express STEP. In stratum oriens of CA1, cell death was specifically observed in STEP-positive cells. CC, Corpus callosum; SO, stratum oriens. Scale bars, 20 μm. C, Results of double labeling in the hilus for STEP and TUNEL, a marker of apoptotic cell death, were consistent with the Fluoro-Jade B staining data; TUNEL-labeled cells were STEP positive. For TUNEL labeling, animals were killed 3 d after SE. Scale bars: A, 100 μm (low-magnification image) and 25 μm (high-magnification image); B, 20 μm; C, 10 μm.
Figure 3.
Figure 3.
FK506 attenuates SE-induced cell death in the hilus. FK506 (1 mg/kg) or vehicle (20% DMSO in saline) was injected intraperitoneally 15 min after pilocarpine injection. Mice were killed 6 h after SE, and cell death was identified by Fluoro-Jade B staining. A, Representative images reveal Fluoro-Jade B-positive cells in the hilus. Scale bar, 100 μm. B, Cell counts of Fluoro-Jade B (FJB)-positive cells reveal that FK506 significantly reduced SE-induced cell death. ***p < 0.001. C, FK506 conferred lasting protection to STEP-expressing hilar (Hil) interneurons. Representative images of STEP immunolabeling in the dentate gyrus from animals killed 7 d after SE are shown. Note the large number of STEP-positive cells in the hilus of mice given injections of FK506 (bottom). In contrast, in the absence of FK506 treatment, STEP-positive cells were not observed in SE-induced mice (middle). Cresyl violet staining (right) is consistent with STEP immunostaining; FK506 attenuated SE-induced cell loss in the hilus. Scale bars: low-magnification images, 100 μm; high-magnification images, 25 μm. D, Quantitation of STEP- and cresyl violet-positive cells 7 d after pilocarpine-induced SE. **p < 0.01. E, Western blotting was used to detect the active (dephosphorylated) and inactive (phosphorylated) form of STEP (p-STEP). Under both control conditions (lane 1) and after pilocarpine injection (lane 3) (15 min after SE onset), STEP migrated in its lower-molecular-weight (dephosphorylated) active form. After FK506 (1 mg/kg) injection alone (lane 2) or with pilocarpine (lane 4), STEP migrated in its higher-molecular-weight (phosphorylated) inactive form. Error bars indicate SEM.
Figure 4.
Figure 4.
STEP and seizure-induced ERK activation. A, Immunolabeling for the activated form of ERK. Under both the control condition [Saline (Sal) + Vehicle (Veh), Panel 1] and 15 min after SE [Pilocarpine (Pilo) + Veh, Panel 2] onset, ERK activity was not observed in the hilus. In contrast, SE triggered a robust increase in ERK activation in the GCL. FK506 alone (1 mg/kg) triggered ERK activation in the hilus (Sal + FK506, Panel 3). ERK activation was also observed in the hilus after SE in mice given injections of FK506 (Pilo + FK506, Panel 4). The boxed regions are magnified images shown to the right of each panel. Arrows denote cells with marked pERK expression. B, Double labeling for pERK and STEP demonstrates that FK506 injection activated ERK signaling in two of the three STEP-positive hilar interneurons. Representative images were taken from animals killed 15 min after SE onset. C, Double labeling demonstrates that FK506 triggered the expression of pERK in somatostatin-positive cells of the hilus. Animals were killed 15 min after SE onset. Arrows denote somatostatinergic cells. Scale bars: A, 100 μm (low-magnification image) and 25 μm (high-magnification image); B, 10 μm; C, 25 μm.
Figure 5.
Figure 5.
Blocking STEP activation triggers immediate-early gene expression. A, SE stimulated FosB (left) and JunB (right) expression in the GCL but not in the hilus. FK506 injection (1 mg/kg, 15 min after pilocarpine injection) significantly increased SE-induced FosB and JunB expression in the hilus. Mice were killed 1.5 h after SE onset. Boxed regions are magnified and shown on the right. Arrows denote cells with immediate-early gene expression. B, Double labeling with FosB and STEP revealed that immediate-early gene expression occurred in STEP-positive hilar cells. C, Quantitative analysis of FosB- or JunB-positive cells in the hilus under the different treatment conditions. Data from six animals were examined for each condition and expressed as the mean ± SEM. **p < 0.01. Error bars indicate SEM. Scale bars: A, 100 μm (low-magnification image) and 25 μm (high-magnification image); B, 10 μm; C, 25 μm.
Figure 6.
Figure 6.
TAT-STEP increases SE-induced cell death and decreases immediate-early gene expression in the cortex. In A–C, His-tagged TAT-STEP was microinjected into the motor cortex via an indwelling guide cannula. SE was induced 2 h later, and mice were killed 6 h after SE onset. A, TAT-STEP was visualized with an anti-His antibody, followed by Alexa 488-conjugated secondary antibody (color-coded red for clarity). The high-magnification image (taken from the boxed region in the left panel) identifies individual cells that had taken up TAT-STEP. B, Cell death was determined using Fluoro-Jade B staining. Compared with the contralateral hemisphere or with the injection of TAT-myc, TAT-STEP increased SE-induced cell death. In saline (Sal)-injected mice, TAT-STEP did not induce cell death. C, Double labeling for Fluoro-Jade B (FJB; left) and TAT-STEP (anti-His; middle) revealed that SE-induced death occurred in TAT-STEP-expressing cells. D, Representative data showing that SE-induced JunB expression was decreased in the TAT-STEP-infused hemisphere compared with the contralateral hemisphere or to TAT-myc infusion. Animals were killed 2 h after SE onset. Scale bars: A, 500 μm (low-magnification image) and 50 μm (high-magnification image); B, 200 μm (low-magnification image) and 50 μm (high-magnification image); B, 10 μm; C, 10 μm; D, 50 μm.
Figure 7.
Figure 7.
STEP increases neuronal vulnerability to excitotoxic cell death. A, Hippocampal neurons isolated from embryonic rat pups were transfected with EGFP expression vector and either a STEP expression vector or an empty expression vector (pcDNA). Two days after transfection, cells were stimulated with NMDA (50 μm) for 15 min, and cell viability was quantified 8 h later using Hoechst staining. A total of 326 pcDNA- and 366 STEP-transfected cells were examined. Arrows identify representative transfected cells that are dying (condensed nuclei); arrowheads denote healthy cells. Scale bar, 50 μm. B, Quantitation of the percentage of transfected neurons undergoing cell death. Relative to control vector transfection, transfection with STEP increased the toxic effects of NMDA (***p < 0.001, significantly different from control vector transfection). C, STEP attenuates MAPK-dependent gene expression. Neurons were transfected with Gal4-ELK and E1B-luciferase reporter and either the STEP expression vector or empty expression vector (pcDNA). Cells were stimulated (15 min) with NMDA (20 μm) or TPA (1 μm) and lysed 6 h later. Both NMDA and TPA stimulated a significant increase in MAPK-dependent reporter gene expression. STEP overexpression blocked both NMDA- and TPA-mediated gene expression. Pretreatment (30 min) with FK506 (1 μm) blocked the repressive effects of STEP. The values are means ± SEM of quadruplicate determinations and are expressed as fold stimulation normalized to the unstimulated pcDNA control, which was set equal to one. ***p < 0.001, significant difference relative to control buffer treatment.

Similar articles

Cited by

References

    1. Aarts M, Liu Y, Liu L, Besshoh S, Arundine M, Gurd JW, Wang YT, Salter MW, Tymianski M. Treatment of ischemic brain damage by perturbing NMDA receptor- PSD-95 protein interactions. Science. 2002;298:846–850. - PubMed
    1. Acsády L, Kamondi A, Sik A, Freund TF, Buzsáki G. GABAergic cells are the major postsynaptic targets of mossy fibers in the rat hippocampus. J Neurosci. 1998;18:3386–3403. - PMC - PubMed
    1. Borges K, Gearing M, McDermott DL, Smith AB, Almonte AG, Wainer BH, Dingledine R. Neuronal and glial pathological changes during epileptogenesis in the mouse pilocarpine model. Exp Neurol. 2003;182:21–34. - PubMed
    1. Boulanger LM, Lombroso PJ, Raghunathan A, During MJ, Wahle P, Naegele JR. Cellular and molecular characterization of a brain-enriched protein tyrosine phosphatase. J Neurosci. 1995;15:1532–1544. - PMC - PubMed
    1. Buckmaster PS, Dudek FE. Neuron loss, granule cell axon reorganization, and functional changes in the dentate gyrus of epileptic kainate-treated rats. J Comp Neurol. 1997;385:385–404. - PubMed

Publication types

MeSH terms

Substances